FIGURE

FIGURE 2

ID
ZDB-FIG-220914-2
Publication
Coffin et al., 2022 - Putative COVID-19 therapies imatinib, lopinavir, ritonavir, and ivermectin cause hair cell damage: A targeted screen in the zebrafish lateral line
Other Figures
All Figure Page
Back to All Figure Page
FIGURE 2

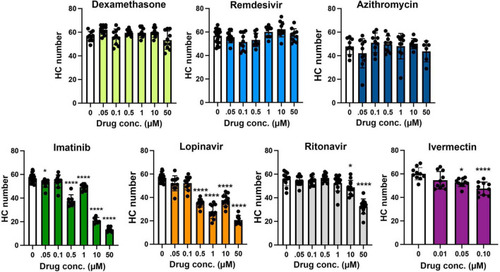
Hair cell quantification following treatment with COVID-19 therapies. Hair cells were counted from images represented in Figure 1. Controls (“0,” white bars) received vehicle, which was methanol for dexamethasone-treated fish and DMSO for all other drugs. Dexamethasone was used as a negative control. Hair cells were counted in five neuromasts per fish and summed to arrive at one value per animal. Data were analyzed by one-way ANOVA followed by Bonferroni-corrected post hoc tests. One-way ANOVA results and sample sizes are as follows: Dexamethasone F(6,63) = 3.53, p = 0.0045, N = 10; Remdesivir F(6,73) = 4.054, p = 0.0015, N = 10–20; Azithromycin F(6,55) = 1.28, p = 0.281, N = 6–10; Imatinib F(6,63) = 188.0, p < 0.0001, N = 6–20; Lopinavir F(6,72) = 80.15, p < 0.0001, N = 9–20; Ritonavir F(6,75) = 27.99, p < 0.0001, N = 11–13; Ivermectin F(3,36) = 8.59, p = 0.0002, N = 10. Asterisks indicate significance differences from vehicle controls. *p < 0.05, ****p < 0.0001. Note that the imatinib and lopinavir experiments were run concurrently and therefore shared control animals. Data are represented as mean ± 1 s.d. and black dots represent individual fish.

Expression Data

Expression Detail
Antibody Labeling
Phenotype Data

Phenotype Detail
Acknowledgments
This image is the copyrighted work of the attributed author or publisher, and ZFIN has permission only to display this image to its users. Additional permissions should be obtained from the applicable author or publisher of the image. Full text @ Front. Cell. Neurosci.