
- Title
-
Scale space detector for analyzing spatiotemporal ventricular contractility and nuclear morphogenesis in zebrafish
- Authors
- Teranikar, T., Villarreal, C., Salehin, N., Ijaseun, T., Lim, J., Dominguez, C., Nguyen, V., Cao, H., Chuong, C.J., Lee, J.
- Source
- Full text @ iScience

Isolating and segmenting cardiomyocyte nuclei from contracting heart using the DOG (Difference of Gaussian) filter in combination with the watershed algorithm (A–D) 48 h postfertilization zebrafish ventricular volume was reconstructed using light sheet microscopy, in order to visualize time-dependent motion of myocardial cardiomyocyte nuclei. Raw volume comprised of fused nuclei clusters (yellow highlighted boxes), exacerbated by tissue scattering (B–D) Zoomed in regions demonstrate fused contours of nuclei, adversely affecting individual nuclei analysis (E) Ventricular volume was processed using the difference of Gaussian (DoG) edge detector in conjunction with the watershed algorithm to distinguish individual nuclei from adjacent neighbors. (F–H) Zoomed in regions show successful separation of nuclei for aiding cell tracking and counting. (I–J) 2D lateral and axial views illustrate tissue birefringence resulting in merging of nuclei longitudinally (K-L) Segmented lateral and axial views were reconstructed for qualitative assessment of contour separation of overlapping nuclei. (scale bar = 100 microns), a: atrium, v: ventricle. |

Isolating individual nuclei volumes among high-density cardiomyocyte clusters, at distinct phases of ventricular contraction cycle (A) Illustration depicting zebrafish ventricular myocardial nuclei sections, scanned by a Gaussian light sheet (blue solid line). There exists a tradeoff between the confocal parameter i.e. excitation lateral extent and beam waist (BW) i.e. light sheet axial resolution and hence, requires optimization of the Gaussian focus spot to effectively sample embryogenesis across different growth stages. The detection objective lens modulates effective field of view (FOV). Samples are scanned through the static optical section at discrete increments (dx) using mechanical transducers, to reconstruct complete in vivo 3days + time volumes from individual sections. Red arrow represents the blood flow direction of zebrafish heart. (B and C) Raw systolic and diastolic nuclei reconstruction at 96 h (about 4 days) post fertilization, consisted of closely packed nuclei blobs as compared to 48 h postfertilization. Inaccurate nuclei localization is further exacerbated by dynamic contraction and relaxation. (D and E) Application of difference of Gaussian (DoG) detector in conjunction with the watershed algorithm, exhibits reduced feature detection sensitivity leading to inaccurate reporting of nuclei number. (F and G) Hessian DoG feature detector exhibits improved sensitivity to local affine transformations experienced by nuclei pixel neighborhoods during image acquisition. (scale bar = 50 micron), av: atrioventricular canal, v: ventricle, ot: outflow tract. |

Visualizing cmlc:GFPnuc zebrafish ventricular nuclei deformation at distinct developmental stages (48 – 96 h postfertilization), across the cardiac contraction cycle (A–I) The Hessian DoG scale space representation was used for localizing cardiomyocyte nuclei ranging from different sizes, as a result of which we were able to assess ventricular contractility and complex nuclei morphology in vivo (scale bar for A-C = 100-micron, scale bar for D-I = 50 micron). A:atrium, v:ventricle. |
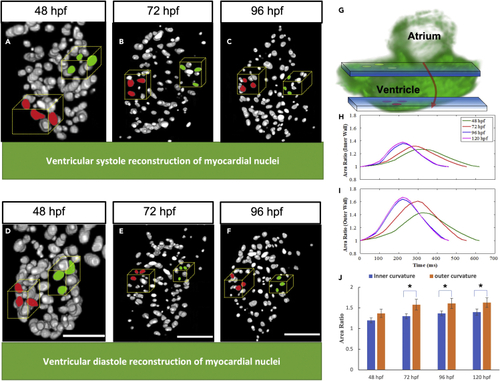
Selected markers utilized area ratio analysis (A–F) represents the systolic reconstruction of ventricular myocytes at 48 hpf, 72 hpf, and 96 hpf, respectively, while (D–F) represents the diastolic reconstruction of myocytes at different developmental stages. (G and H) Schematic illustrating the nuclei region of interest. Blue windows represent light sheet sections. Zebrafish ventricular volumes were sampled to compare the innermost curvature contractility (green markers), with respect to the outermost curvature (red markers) (H) Area ratio for innermost curvature by tracking three cardiomyocytes highlighted green in the blue optical plane, which elucidate increasing contractility trend observed across distinct developmental stages. (I) The area ratio for outermost curvature calculated by tracking cardiomyocytes highlighted red in the blue optical plane, indicates the outermost curvature has higher contractility compared to the innermost curvature. (J) Outermost curvature has a significantly higher area ratio compared to innermost curvature after 72 hpf (n = 3, p = 0.05, one-tail t-test). |
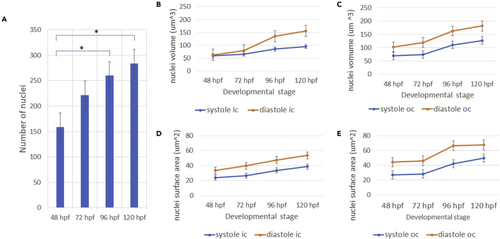
Zebrafish cardiomyocyte nuclei analysis (A and B) We observed an increase in the number of ventricular cardiomyocyte nuclei for successive developmental stages. Asterisk denotes statistically significant difference with respect to previous time point. p ≤ 0.05 (B) Systolic and diastolic nuclei volume expansion observed for the inner curvature. (C) Systolic and diastolic volume trends observed for the outer curvature. (D and E) Systolic and diastolic nuclei surface area growth observed for the inner curvature (E) Systolic and diastolic nuclei surface area observed for the outer curvature. n = 15. |

Systole vs diastole circularity analysis (A) Inner curvature nuclei are observed to have a circular shape, (symmetric circle elongation = 1, ellipse <1) with slightly higher values observed for the diastole. (B) Outer curvature cardiomyocyte nuclei are observed to have an elongated shape with higher elongation observed in the diastole. (C and D) Volumetric reconstructions of the circular shape of inner curvature and elliptic shape of outer curvature myocytes were visually presented, respectively. In addition, the corresponding lateral and axial views are shown with binary images (scale bar = 15 um). |