
|
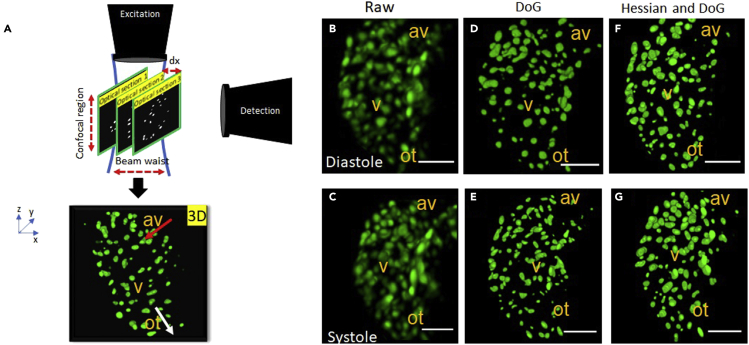
Fig. 2
Isolating individual nuclei volumes among high-density cardiomyocyte clusters, at distinct phases of ventricular contraction cycle
(A) Illustration depicting zebrafish ventricular myocardial nuclei sections, scanned by a Gaussian light sheet (blue solid line). There exists a tradeoff between the confocal parameter i.e. excitation lateral extent and beam waist (BW) i.e. light sheet axial resolution and hence, requires optimization of the Gaussian focus spot to effectively sample embryogenesis across different growth stages. The detection objective lens modulates effective field of view (FOV). Samples are scanned through the static optical section at discrete increments (dx) using mechanical transducers, to reconstruct complete in vivo 3days + time volumes from individual sections. Red arrow represents the blood flow direction of zebrafish heart.
(B and C) Raw systolic and diastolic nuclei reconstruction at 96 h (about 4 days) post fertilization, consisted of closely packed nuclei blobs as compared to 48 h postfertilization. Inaccurate nuclei localization is further exacerbated by dynamic contraction and relaxation.
(D and E) Application of difference of Gaussian (DoG) detector in conjunction with the watershed algorithm, exhibits reduced feature detection sensitivity leading to inaccurate reporting of nuclei number.
(F and G) Hessian DoG feature detector exhibits improved sensitivity to local affine transformations experienced by nuclei pixel neighborhoods during image acquisition. (scale bar = 50 micron), av: atrioventricular canal, v: ventricle, ot: outflow tract.