
FIGURE
Fig. 5
- ID
- ZDB-FIG-220831-57
- Publication
- Teranikar et al., 2022 - Scale space detector for analyzing spatiotemporal ventricular contractility and nuclear morphogenesis in zebrafish
- Other Figures
- All Figure Page
- Back to All Figure Page
Fig. 5
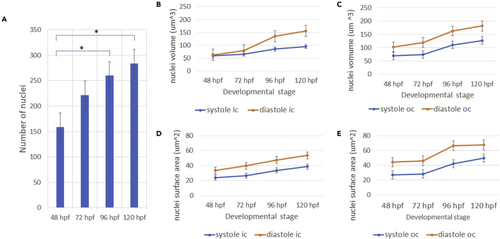
Zebrafish cardiomyocyte nuclei analysis (A and B) We observed an increase in the number of ventricular cardiomyocyte nuclei for successive developmental stages. Asterisk denotes statistically significant difference with respect to previous time point. p ≤ 0.05 (B) Systolic and diastolic nuclei volume expansion observed for the inner curvature. (C) Systolic and diastolic volume trends observed for the outer curvature. (D and E) Systolic and diastolic nuclei surface area growth observed for the inner curvature (E) Systolic and diastolic nuclei surface area observed for the outer curvature. n = 15. |
Expression Data
Expression Detail
Antibody Labeling
Phenotype Data
Phenotype Detail
Acknowledgments
This image is the copyrighted work of the attributed author or publisher, and
ZFIN has permission only to display this image to its users.
Additional permissions should be obtained from the applicable author or publisher of the image.
Full text @ iScience