
- Title
-
p38 MAPK-dependent phosphorylation of transcription factor SOX2 promotes an adaptive response to BRAF inhibitors in melanoma cells
- Authors
- Pietrobono, S., De Paolo, R., Mangiameli, D., Marranci, A., Battisti, I., Franchin, C., Arrigoni, G., Melisi, D., Poliseno, L., Stecca, B.
- Source
- Full text @ J. Biol. Chem.
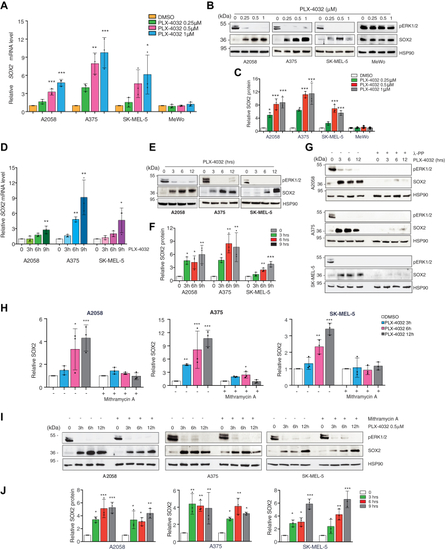
SOX2 is upregulated in PLX-4032-treated melanoma cells.A, qPCR of SOX2 in BRAFV600E (A2058, A375, SK-MEL-5) and BRAF WT (MeWo) melanoma cells treated with increasing doses of PLX-4032. Gene expression was normalized relative to TBP housekeeping gene (mean ± SD). p value was calculated by ANOVA and Dunnett’s test (n = 3 biological independent experiments). B, representative Western blot of SOX2 and pERK1/2 in BRAFV600E (A2058, A375, SK-MEL-5) and BRAF WT (MeWo) melanoma cells treated with increasing doses of PLX-4032. HSP90 was used as loading control. C, relative quantification of SOX2 shown in (B) expressed as mean ± SD of three independent experiments. p value was calculated by ANOVA and Dunnett’s test. D and E, qPCR of SOX2 (D) and representative Western blot (E) of SOX2 and pERK1/2 in BRAFV600E melanoma cells treated with PLX-4032 (0.5 μM) for the indicated time points. In (D) gene expression was normalized relative to TBP (mean ± SD). p value was calculated by ANOVA and Dunnett’s test (n = 3). F, quantification of SOX2 shown in (E) expressed as mean ± SD of three independent experiments. p value was calculated by ANOVA and Dunnett’s test (n = 3 biological independent experiments). HSP90 was used as loading control. G, representative Western blot of SOX2 and pERK1/2 in BRAFV600E melanoma cells treated with λ-protein phosphatase (100U) and PLX-4032 (0.5 μM) at the indicated time. HSP90 was used as loading control. H and I, qPCR of SOX2 (H) and representative Western blot (I) of SOX2 and pERK1/2 in BRAFV600E melanoma cells treated with Mithramycin A (200 nM) and PLX-4032 (0.5 μM) at the indicated time. In (H) gene expression was normalized relative to TBP and expressed as mean ± SD. p value was calculated by ANOVA and Dunnett’s test (n = 3). J, quantification of SOX2 shown in (I) expressed as mean ± SD of three independent experiments. p value was calculated by ANOVA and Dunnett’s test (n = 3 biological independent experiments). HSP90 was used as loading control. Molecular weight markers are noted next to all immunoblots. ∗p < 0.05; ∗∗p < 0.01; ∗∗∗p < 0.001. qPCR, quantitative PCR. |
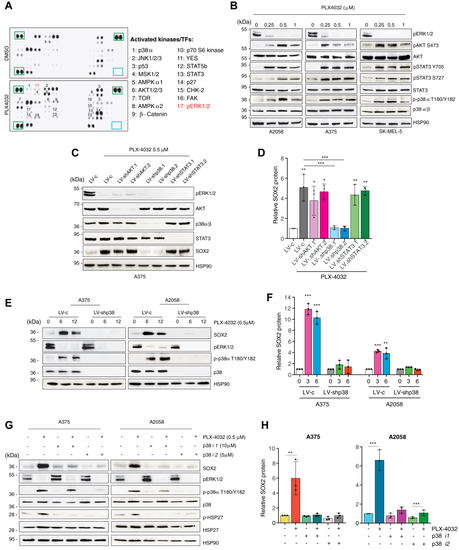
Inhibition of p38 prevents the increase of SOX2 upon treatment with PLX-4032.A, representative phosphokinase array in A375 treated with vehicle (DMSO) or PLX-4032 (0.5 μM) for 12 h. Green squares indicate loading controls. B, representative Western blot of pERK1/2, pAKT-S473, total AKT, pSTAT3-Y705, pSTAT3-S727, total STAT3, p-p38α-T180/Y182, and total p38α/β in BRAFV600E melanoma cells treated with DMSO or PLX-4032 at the indicated doses for 12 h. HSP90 was used as loading control. C, representative Western blot of pERK1/2, AKT, p38α/β, STAT3, and SOX2 in A375 cells transduced as indicated and treated with DMSO or PLX-4032 (0.5 μM) for 12 h. HSP90 was used as loading control. D, relative quantification of SOX2 in (C) expressed as mean ± SD. p value was calculated by ANOVA and Tukey’s test (n = 3 biological independent experiments). E, representative Western blot of SOX2, pERK1/2, p-p38α-T180/Y182, and total p38α/β in A375 and A2058 cells transduced with LV-c or LV-shp38 and treated with DMSO or PLX-4032 (0.5 μM). HSP90 was used as loading control. F, relative quantification of SOX2 protein as shown in (E), expressed as mean ± SD of three independent experiments. p value was calculated by ANOVA and Dunnett’s test (n = 3 biological independent experiments). G, representative Western blot of SOX2, pERK1/2, p-p38α-T180/Y182, total p38α/β, p-HSP27, and total HSP27 in A375 and A2058 cells treated for 36 h with LY2228820 (p38i1) or SB202190 (p38i2), followed by DMSO or PLX-4032 (0.5 μM) for additional 12 h. HSP90 was used as loading control. H, relative quantification of SOX2 protein as shown in (G), expressed as mean ± SD of three independent experiments. Untreated controls were set to 1. p value was calculated by ANOVA and Tukey’s test (n = 3 biological independent experiments). Molecular weight markers are noted next to all immunoblots. ∗p < 0.05; ∗∗p < 0.01; ∗∗∗p < 0.001. DMSO, dimethyl sulfoxide. |
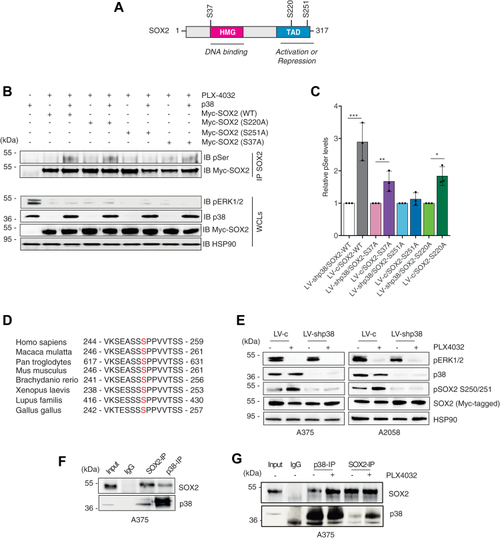
Silencing of p38 abrogates phosphorylation of SOX2 at serine 251.A, schematic representation of SOX2 protein with indicated the high mobility group (HMG), the transactivation domain (TAD), and the three putative p38 phosphorylation sites (S37, S220, S251). B, representative immunoprecipitation of exogenous, Myc-tagged SOX2-WT or mutants (S37A, S220A, S251A) in A375 cells treated PLX-4032 (0.5 μM) for 3 h in presence (LV-c) or absence of p38 (LV-shp38), followed by immunoblotting with antiphospho-serine (pSer) antibody, in presence (LV-c) or absence of p38 (LV-shp38). C, quantification of pSer after IP of SOX2, expressed as mean ± SD of three independent experiments, with the level induced by SOX2 WT, SOX2-S37A, SOX2-S220A, and SOX2-S251A in absence of p38 equated to 1. p value was calculated by two-tailed unpaired Student’s t test. Note that p38 increases phosphorylation of SOX2-WT, SOX2-S37A, and SOX2-S220A but not of SOX2-S251A. D, residue Ser251 lies in a region of human SOX2 proteins conserved among species. E, representative Western blot of pERK1/2, p38α/β, pSOX2-S250/S251, and SOX2 in A375 and A2058 cells transduced with LV-c or LV-shp38, transiently transfected with exogenous, Myc-tagged SOX2 and treated with DMSO or PLX-4032 (0.5 μM) for 3 h. HSP90 was used as loading control. F, coimmunoprecipitation (co-IP) of SOX2 and p38 in A375 lysates. Input was 5%. G, co-IP of SOX2 and p38 in A375 lysates upon treatment with DMSO or PLX-4032 (0.5 μM) for 3 h. Input was 5%. Molecular weight markers are noted next to all immunoblots. ∗p < 0.05; ∗∗p < 0.01; ∗∗∗p < 0.001. DMSO, dimethyl sulfoxide. |
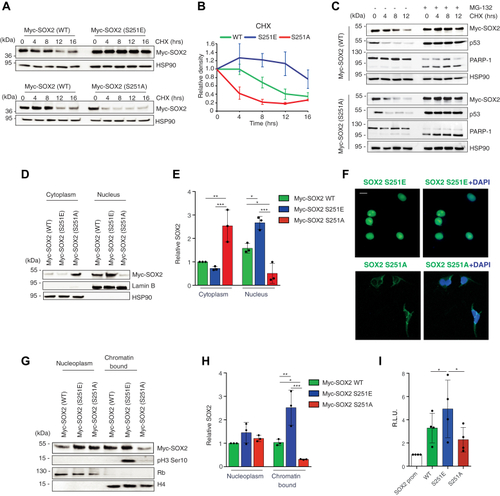
Phosphorylation at Ser251 is critical for SOX2 stability, nuclear localization, and transcriptional activity.A, representative Western blot of Myc-SOX2 in A375 cells transiently transfected with equimolar amount of Myc-tagged SOX2-WT, SOX2-S251E, or SOX2-S251A after cycloheximide (CHX) treatment for the indicated time. CHX chase shows that SOX2-S251E has increased protein stability compared to SOX2 WT, whereas SOX2-S251A displays a reduced half-life. HSP90 was used as loading control. B, densitometric quantification of the data in (A) (N = 3). C, representative Western blot of SOX2, p53, and PARP-1 in A375 cells transiently transfected with Myc-tagged SOX2 WT or Myc-tagged SOX2-S251A and treated with CHX (100 μg/ml) for the indicated time in combination with the proteasome inhibitor MG-132 (100 nM). HSP90 was used as loading control. D, nuclear-cytoplasmic fractionation in A375 cells transiently transfected with equimolar amount of Myc-tagged SOX2 WT, S251E, and S251A. Lamin B and HSP90 were used as nuclear and cytoplasmic markers, respectively. E, relative quantification of SOX2 protein as shown in (D) expressed as mean ± SD of three independent experiments. p value was calculated by ANOVA and Tukey’s test. F, representative immunofluorescence of SOX2 Ser251 phosphorylation in A375 transiently transfected with equimolar amount of SOX2-S251E or SOX2-S251A. The scale bar represents 10 μm. G, nucleoplasm and chromatin-bound fractions of A375 cells transiently transfected with equimolar amounts of Myc-tagged SOX2 WT, S251E, and S251A. Rb and histone H4 were used as nucleoplasm or chromatin-bound markers, respectively. H, relative quantification of SOX2 protein as shown in (G) expressed as mean ± SD. p value was calculated by ANOVA and Tukey’s test (n = 3). I, quantification of dual reporter luciferase assay in A375 cells showing that SOX2 S251E has increased ability to induce the transcription of SOX2 promoter compared to SOX2 WT and SOX2 S251A. Relative luciferase activity was firefly/Renilla ratio, with the level induced by control equated to 1. p value was calculated by ANOVA and Tukey’s test (mean ± SD, n = 4). Molecular weight markers are noted next to all immunoblots. ∗p < 0.05; ∗∗p < 0.01; ∗∗∗p < 0.001. |
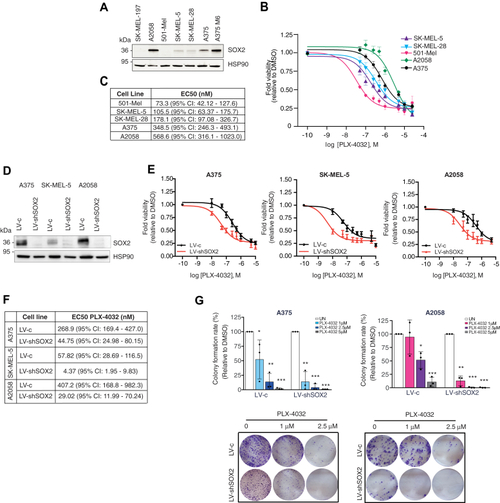
SOX2 depletion increases sensitivity of melanoma cells to PLX-4032 treatment.A, Western blot of SOX2 in a panel of BRAFV600E melanoma cells. HSP90 was used as loading control. B and C, dose response curves (B) of PLX-4032 in melanoma cells after 72 h treatment. Table in (C) reports EC50 of PLX-4032 in melanoma cells of at least five independent experiments. D, representative Western blot of SOX2 in A375, SK-MEL-5, and A2058 melanoma cells transduced with LV-c or LV-shSOX2. HSP90 was used as loading control. E and F, dose response curves (E) of A375, SK-MEL-5, and A2058 cells transduced with LV-c or LV-shSOX2 and treated with DMSO or increasing doses of PLX-4032 for 72 h. The EC50 values of PLX-4032 are reported in (F). (N = 3). G, colony formation rate in A375 and A2058 cells transduced with LV-c or LV-shSOX2 and treated with DMSO or increasing doses of PLX-4032 (upper panels). Lower panels show images of colony growth (detected by crystal violet staining). Molecular weight markers are noted next to all immunoblots. p value was calculated by ANOVA and Dunnett’s test (n = 3 biological independent experiments). ∗p < 0.05; ∗∗p < 0.01; ∗∗∗p < 0.001. |
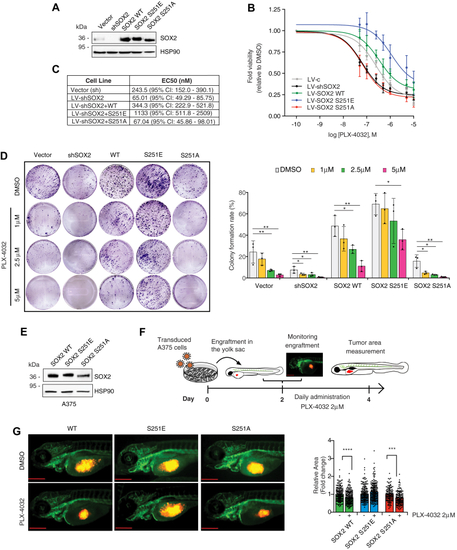
Phosphorylation of SOX2 at Ser251 desensitizes melanoma cells to PLX-4032 treatment.A, representative Western blot of SOX2 in A375 cells transduced with empty vector (LV-c) or silenced for SOX2 (LV-shSOX2) and then reconstituted with SOX2 WT or mutants (S251E or S251A). HSP90 serves as loading control. B and C, dose response curves (B) of PLX-4032 in A375 cells transduced with empty vector (LV-c) or silenced for SOX2 (LV-shSOX2) and reconstituted with SOX2 WT or mutants (S251E or S251A). Table in (C) reports EC50 of PLX-4032 in melanoma cells of at least three independent experiments. D, colony formation rate of A375 transduced as indicated and treated with increasing doses of PLX-4032. Representative images of colony assay are shown on the left. p value was calculated by ANOVA and Dunnett’s test (n = 3 biological independent experiments). E, representative Western blot of SOX2 in SOX2-silenced A375 cells transduced with SOX2 WT, SOX2-S251E, and SOX2-S251A used for zebrafish xenografts. HSP90 was used as loading control. F, schematic representation of engraftment and treatment of zebrafish embryos. The scale bar represents 500 μm. G, volume and growth of A375 xenografts in zebrafish embryos. Left panel, images of A375 xenografts after transduction with SOX2 WT, SOX2-S251E, and SOX2-S251A, and treatment with vehicle (DMSO) or PLX-4032 for 48 h; right panel, quantification of xenograft relative area of three biological independent experiments. The scale bar represents 500 μm. Note that overexpression of SOX2-S251E prevents reduction of tumor growth following PLX-4032 treatment. Molecular weight markers are noted next to all immunoblots. ∗p < 0.05; ∗∗p < 0.01; ∗∗∗p < 0.001. DMSO, dimethyl sulfoxide. |
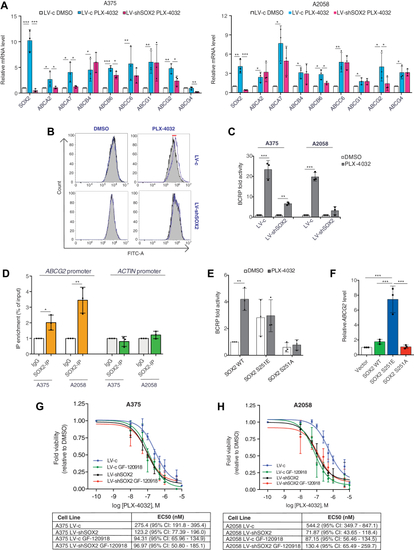
Treatment of melanoma cells with PLX-4032 promotes multidrug resistance through SOX2.A, qPCR of ABC genes in A375 (left) and A2058 (right) melanoma cells transduced with LV-c of LV-shSOX2 and treated with DMSO or PLX-4032 (0.5 μM) for 12 h. Gene expression was normalized relative to TBP housekeeping gene (mean ± SD). p value was calculated by ANOVA and Tukey’s test (n = 3 biological independent experiments). B, BRAFV600E melanoma cells were incubated with efflux green detection reagent with and without specific inhibitors according to the kit protocol. Resulting fluorescence was measured using flow cytometry. Nontinted histograms show fluorescence of BCRP inhibitor-treated A375 samples, and tinted histograms show fluorescence of untreated cells. C, quantification of BCRP activity in A375 and A2058 cells transduced with LV-c or LV-shSOX2 and treated with EC50 values of PLX-4032, obtained after calculation of the relative MAF (multidrug resistance activity factors) values. The levels induced by controls (LV-c, DMSO) were equated to 1. p value was calculated by two-tailed unpaired Student’s t test (n = 3). D, chIP-qPCR of SOX2 occupancy at ABCG2 promoter in A375 and A2058 cells. The y-axis represents relative promoter enrichment, normalized on input material. IgG was set to 1. ACTIN promoter was used as negative control. Data are represented as mean ± SD of n = 3 biological independent experiments. p value was calculated by two-tailed unpaired Student’s t test. E, quantification of BCRP activity in A375 cells transduced with empty vector (LV-c) or silenced for SOX2 (LV-shSOX2) and then reconstituted with SOX2 WT or mutants (S251E or S251A). p value was calculated by two-tailed unpaired Student’s t test (n = 3). F, qPCR of ABCG2 in A375 transduced as indicated. Gene expression was normalized relative to TBP housekeeping gene (mean ± SD). p value was calculated by ANOVA and Tukey’s test (n = 3 biological independent experiments). G and H, dose response curves of A375 (G) and A2058 (H) treated for 72 h with PLX-4032 in absence or presence of 1 μM GF-120918 in melanoma cells (72 h treatment). Tables report the EC50 of PLX-4032 in melanoma cells of at least three independent experiments. ∗p < 0.05; ∗∗p < 0.01; ∗∗∗p < 0.001; ns, not significant. DMSO, dimethyl sulfoxide; qPCR, quantitative PCR. |