
Figure 1
- ID
- ZDB-FIG-220914-28
- Publication
- Pietrobono et al., 2022 - p38 MAPK-dependent phosphorylation of transcription factor SOX2 promotes an adaptive response to BRAF inhibitors in melanoma cells
- Other Figures
- All Figure Page
- Back to All Figure Page
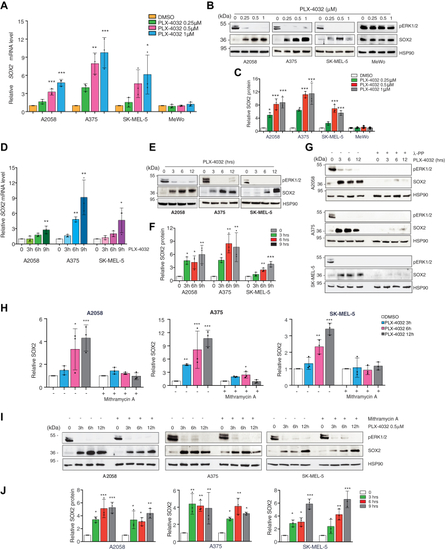
SOX2 is upregulated in PLX-4032-treated melanoma cells.A, qPCR of SOX2 in BRAFV600E (A2058, A375, SK-MEL-5) and BRAF WT (MeWo) melanoma cells treated with increasing doses of PLX-4032. Gene expression was normalized relative to TBP housekeeping gene (mean ± SD). p value was calculated by ANOVA and Dunnett’s test (n = 3 biological independent experiments). B, representative Western blot of SOX2 and pERK1/2 in BRAFV600E (A2058, A375, SK-MEL-5) and BRAF WT (MeWo) melanoma cells treated with increasing doses of PLX-4032. HSP90 was used as loading control. C, relative quantification of SOX2 shown in (B) expressed as mean ± SD of three independent experiments. p value was calculated by ANOVA and Dunnett’s test. D and E, qPCR of SOX2 (D) and representative Western blot (E) of SOX2 and pERK1/2 in BRAFV600E melanoma cells treated with PLX-4032 (0.5 μM) for the indicated time points. In (D) gene expression was normalized relative to TBP (mean ± SD). p value was calculated by ANOVA and Dunnett’s test (n = 3). F, quantification of SOX2 shown in (E) expressed as mean ± SD of three independent experiments. p value was calculated by ANOVA and Dunnett’s test (n = 3 biological independent experiments). HSP90 was used as loading control. G, representative Western blot of SOX2 and pERK1/2 in BRAFV600E melanoma cells treated with λ-protein phosphatase (100U) and PLX-4032 (0.5 μM) at the indicated time. HSP90 was used as loading control. H and I, qPCR of SOX2 (H) and representative Western blot (I) of SOX2 and pERK1/2 in BRAFV600E melanoma cells treated with Mithramycin A (200 nM) and PLX-4032 (0.5 μM) at the indicated time. In (H) gene expression was normalized relative to TBP and expressed as mean ± SD. p value was calculated by ANOVA and Dunnett’s test (n = 3). J, quantification of SOX2 shown in (I) expressed as mean ± SD of three independent experiments. p value was calculated by ANOVA and Dunnett’s test (n = 3 biological independent experiments). HSP90 was used as loading control. Molecular weight markers are noted next to all immunoblots. ∗p < 0.05; ∗∗p < 0.01; ∗∗∗p < 0.001. qPCR, quantitative PCR. |