
Figure 7
- ID
- ZDB-FIG-220914-35
- Publication
- Pietrobono et al., 2022 - p38 MAPK-dependent phosphorylation of transcription factor SOX2 promotes an adaptive response to BRAF inhibitors in melanoma cells
- Other Figures
- All Figure Page
- Back to All Figure Page
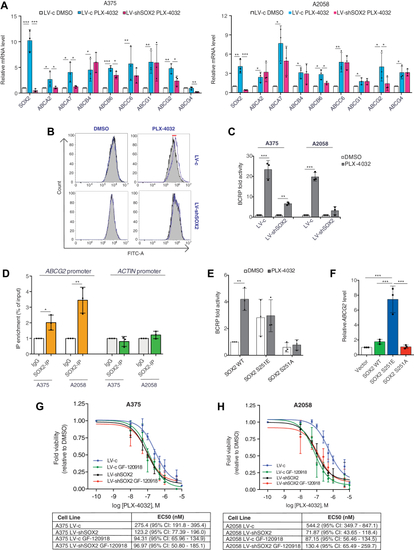
Treatment of melanoma cells with PLX-4032 promotes multidrug resistance through SOX2.A, qPCR of ABC genes in A375 (left) and A2058 (right) melanoma cells transduced with LV-c of LV-shSOX2 and treated with DMSO or PLX-4032 (0.5 μM) for 12 h. Gene expression was normalized relative to TBP housekeeping gene (mean ± SD). p value was calculated by ANOVA and Tukey’s test (n = 3 biological independent experiments). B, BRAFV600E melanoma cells were incubated with efflux green detection reagent with and without specific inhibitors according to the kit protocol. Resulting fluorescence was measured using flow cytometry. Nontinted histograms show fluorescence of BCRP inhibitor-treated A375 samples, and tinted histograms show fluorescence of untreated cells. C, quantification of BCRP activity in A375 and A2058 cells transduced with LV-c or LV-shSOX2 and treated with EC50 values of PLX-4032, obtained after calculation of the relative MAF (multidrug resistance activity factors) values. The levels induced by controls (LV-c, DMSO) were equated to 1. p value was calculated by two-tailed unpaired Student’s t test (n = 3). D, chIP-qPCR of SOX2 occupancy at ABCG2 promoter in A375 and A2058 cells. The y-axis represents relative promoter enrichment, normalized on input material. IgG was set to 1. ACTIN promoter was used as negative control. Data are represented as mean ± SD of n = 3 biological independent experiments. p value was calculated by two-tailed unpaired Student’s t test. E, quantification of BCRP activity in A375 cells transduced with empty vector (LV-c) or silenced for SOX2 (LV-shSOX2) and then reconstituted with SOX2 WT or mutants (S251E or S251A). p value was calculated by two-tailed unpaired Student’s t test (n = 3). F, qPCR of ABCG2 in A375 transduced as indicated. Gene expression was normalized relative to TBP housekeeping gene (mean ± SD). p value was calculated by ANOVA and Tukey’s test (n = 3 biological independent experiments). G and H, dose response curves of A375 (G) and A2058 (H) treated for 72 h with PLX-4032 in absence or presence of 1 μM GF-120918 in melanoma cells (72 h treatment). Tables report the EC50 of PLX-4032 in melanoma cells of at least three independent experiments. ∗p < 0.05; ∗∗p < 0.01; ∗∗∗p < 0.001; ns, not significant. DMSO, dimethyl sulfoxide; qPCR, quantitative PCR. |