
Figure 2
- ID
- ZDB-FIG-220914-29
- Publication
- Pietrobono et al., 2022 - p38 MAPK-dependent phosphorylation of transcription factor SOX2 promotes an adaptive response to BRAF inhibitors in melanoma cells
- Other Figures
- All Figure Page
- Back to All Figure Page
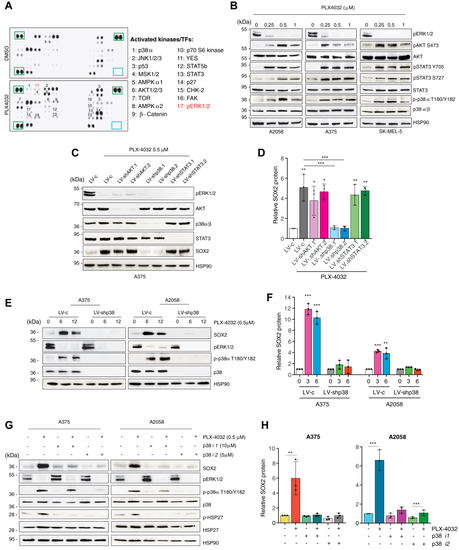
Inhibition of p38 prevents the increase of SOX2 upon treatment with PLX-4032.A, representative phosphokinase array in A375 treated with vehicle (DMSO) or PLX-4032 (0.5 μM) for 12 h. Green squares indicate loading controls. B, representative Western blot of pERK1/2, pAKT-S473, total AKT, pSTAT3-Y705, pSTAT3-S727, total STAT3, p-p38α-T180/Y182, and total p38α/β in BRAFV600E melanoma cells treated with DMSO or PLX-4032 at the indicated doses for 12 h. HSP90 was used as loading control. C, representative Western blot of pERK1/2, AKT, p38α/β, STAT3, and SOX2 in A375 cells transduced as indicated and treated with DMSO or PLX-4032 (0.5 μM) for 12 h. HSP90 was used as loading control. D, relative quantification of SOX2 in (C) expressed as mean ± SD. p value was calculated by ANOVA and Tukey’s test (n = 3 biological independent experiments). E, representative Western blot of SOX2, pERK1/2, p-p38α-T180/Y182, and total p38α/β in A375 and A2058 cells transduced with LV-c or LV-shp38 and treated with DMSO or PLX-4032 (0.5 μM). HSP90 was used as loading control. F, relative quantification of SOX2 protein as shown in (E), expressed as mean ± SD of three independent experiments. p value was calculated by ANOVA and Dunnett’s test (n = 3 biological independent experiments). G, representative Western blot of SOX2, pERK1/2, p-p38α-T180/Y182, total p38α/β, p-HSP27, and total HSP27 in A375 and A2058 cells treated for 36 h with LY2228820 (p38i1) or SB202190 (p38i2), followed by DMSO or PLX-4032 (0.5 μM) for additional 12 h. HSP90 was used as loading control. H, relative quantification of SOX2 protein as shown in (G), expressed as mean ± SD of three independent experiments. Untreated controls were set to 1. p value was calculated by ANOVA and Tukey’s test (n = 3 biological independent experiments). Molecular weight markers are noted next to all immunoblots. ∗p < 0.05; ∗∗p < 0.01; ∗∗∗p < 0.001. DMSO, dimethyl sulfoxide. |