
Figure 6
- ID
- ZDB-FIG-220914-34
- Publication
- Pietrobono et al., 2022 - p38 MAPK-dependent phosphorylation of transcription factor SOX2 promotes an adaptive response to BRAF inhibitors in melanoma cells
- Other Figures
- All Figure Page
- Back to All Figure Page
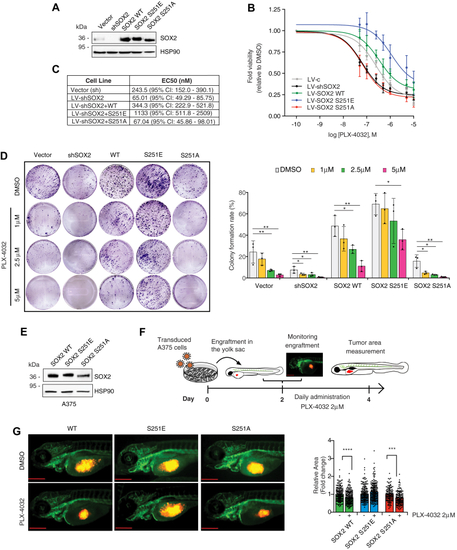
Phosphorylation of SOX2 at Ser251 desensitizes melanoma cells to PLX-4032 treatment.A, representative Western blot of SOX2 in A375 cells transduced with empty vector (LV-c) or silenced for SOX2 (LV-shSOX2) and then reconstituted with SOX2 WT or mutants (S251E or S251A). HSP90 serves as loading control. B and C, dose response curves (B) of PLX-4032 in A375 cells transduced with empty vector (LV-c) or silenced for SOX2 (LV-shSOX2) and reconstituted with SOX2 WT or mutants (S251E or S251A). Table in (C) reports EC50 of PLX-4032 in melanoma cells of at least three independent experiments. D, colony formation rate of A375 transduced as indicated and treated with increasing doses of PLX-4032. Representative images of colony assay are shown on the left. p value was calculated by ANOVA and Dunnett’s test (n = 3 biological independent experiments). E, representative Western blot of SOX2 in SOX2-silenced A375 cells transduced with SOX2 WT, SOX2-S251E, and SOX2-S251A used for zebrafish xenografts. HSP90 was used as loading control. F, schematic representation of engraftment and treatment of zebrafish embryos. The scale bar represents 500 μm. G, volume and growth of A375 xenografts in zebrafish embryos. Left panel, images of A375 xenografts after transduction with SOX2 WT, SOX2-S251E, and SOX2-S251A, and treatment with vehicle (DMSO) or PLX-4032 for 48 h; right panel, quantification of xenograft relative area of three biological independent experiments. The scale bar represents 500 μm. Note that overexpression of SOX2-S251E prevents reduction of tumor growth following PLX-4032 treatment. Molecular weight markers are noted next to all immunoblots. ∗p < 0.05; ∗∗p < 0.01; ∗∗∗p < 0.001. DMSO, dimethyl sulfoxide. |