
- Title
-
Developmental switch in the function of inhibitory commissural V0d interneurons in zebrafish
- Authors
- Picton, L.D., Björnfors, E.R., Fontanel, P., Pallucchi, I., Bertuzzi, M., El Manira, A.
- Source
- Full text @ Curr. Biol.
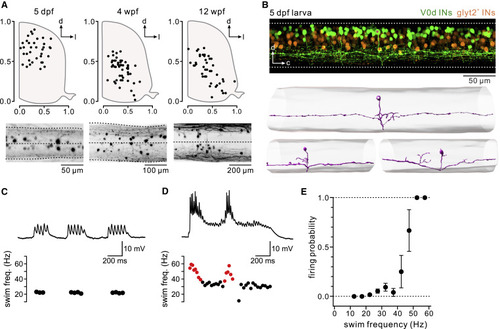
Figure 1. Position, morphology, and recruitment at fast locomotor speeds of V0d interneurons in young zebrafish larvae (A) Soma positions of V0d interneurons at three different stages of development (5 days post-fertilization [dpf], 4 weeks post-fertilization [wpf], and 12 wpf) (n = 4 fish for each stage). Images below show the maximum intensity confocal projections of spinal cords from a dorsal view at each stage. (B) Top: confocal image showing V0d interneuron soma position (green) in the dorsal spinal cord in a 5-dpf zebrafish larva. Non-V0d glycinergic interneurons are shown in orange. Bottom: example morphological reconstructions of bifurcating V0d interneurons in a 5-dpf zebrafish. Asterisks mark the same neuron expressing GFP (top panel) and reconstructed (lower panel). (C) Top: patch-clamp recording of a larval (5 dpf) V0d interneuron showing a lack of recruitment at slow locomotor speeds. Bottom: a plot of instantaneous swim frequency. Black dots represent unrecruited swim cycles. (D) Top: same recording as (C) showing recruitment at fast swim speeds. Bottom: a plot of instantaneous swim frequency. Black dots represent unrecruited swim cycles, and red dots represent cycles in which the V0d interneuron was recruited. (E) Plot of firing probability against swim frequency across recorded V0d interneurons. V0d interneuron firing probability was the highest at fast locomotor frequencies (n = 12 V0d interneurons from 12 separate animals; mean and SEM). See also Figure S1. |
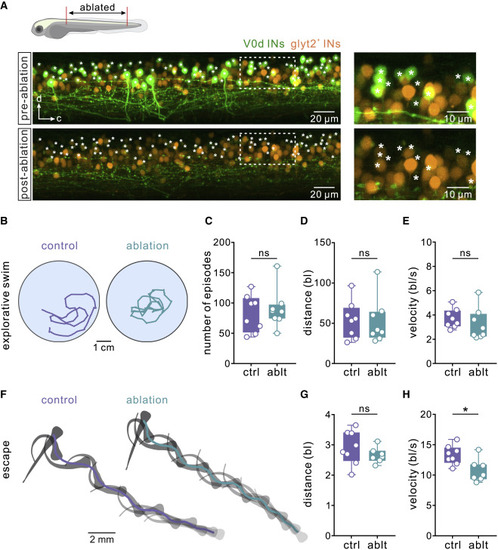
Figure 2. Ablation of V0d interneurons in young larval zebrafish affects escape behavior but not spontaneous swimming (A) Confocal images of the spinal cord of a larval zebrafish (5 dpf) showing V0d interneurons before (“pre-ablation”) and after two-photon laser ablation (“post-ablation”). The panel on the right shows the expansion of the area indicated by a dashed line. V0d interneurons are shown in green and non-V0d glycinergic interneurons in orange. (B) Tracking of spontaneous explorative swimming in vivo in a control larval zebrafish and following the ablation of V0d interneurons. (C) Ablation of V0d interneurons had no effect on the number of spontaneous swim episodes (n = 8 control animals; n = 8 ablated animals; two-tailed Student’s t test). (D) Ablation of V0d interneurons had no effect on the overall spontaneous swim distance (n = 8 control animals; n = 8 ablated animals; Mann-Whitney test). (E) Ablation of V0d interneurons had no effect on swim velocity (n = 8 control animals; n = 8 ablated animals; two-tailed Student’s t test). (F) A sequence of escape and fast swimming evoked by a sound stimulus in control and in a V0d-ablated larval zebrafish. (G) Ablation of V0d interneurons had no effect on escape distance (n = 8 control animals; n = 7 ablated animals; two-tailed Student’s t test). (H) Ablation of V0d interneurons significantly reduced the overall velocity of the evoked escape sequence (n = 8 control animals; n = 7 ablated animals; ∗p < 0.05; two-tailed Student’s t test). See also Figure S1. |
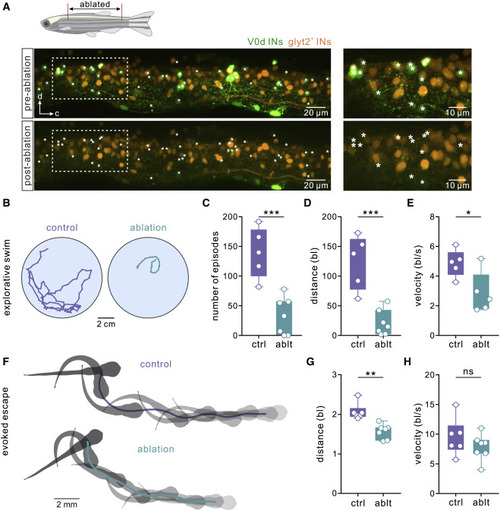
Figure 3. Ablation of V0d interneurons in juvenile zebrafish affects spontaneous swimming (A) Confocal images of the spinal cord of a juvenile zebrafish (6 wpf) showing V0d interneurons before (“pre-ablation”) and after two-photon laser ablation (“post-ablation”). The panel on the right shows the expansion of the area indicated by a dashed line. V0d interneurons are shown in green and non-V0d glycinergic interneurons in orange. (B) Tracking of in vivo spontaneous swimming in control and following the ablation of V0d interneurons in juvenile zebrafish. (C) Ablation of V0d interneurons significantly reduced the number of spontaneous swim episodes (n = 5 control animals; n = 7 ablated animals; ∗∗∗p < 0.001; two-tailed Student’s t test). (D) Ablation of V0d interneurons significantly reduced the overall spontaneous swim distance (n = 5 control animals; n = 7 ablated animals; ∗∗∗p < 0.001; two-tailed Student’s t test). (E) Ablation of V0d interneurons significantly reduced the overall swim velocity (n = 5 control animals; n = 7 ablated animals; ∗p < 0.05; two-tailed Student’s t test). (F) A sequence of escape and fast swimming evoked by a sound stimulus in control and in a V0d-ablated juvenile zebrafish. (G) Ablation of V0d interneurons significantly reduced the overall escape distance (n = 6 control animals; n = 7 ablated animals; ∗∗p < 0.01; Mann-Whitney test). (H) Ablation of V0d interneurons had no significant effect on the velocity of the escape sequence (n = 6 control animals; n = 7 ablated animals; two-tailed Student’s t test). See also Figure S1. |

Figure 4. Activity pattern of V0d interneuron subtypes during fictive locomotion in adult zebrafish (A) Recordings of a slow V0d interneuron showing recruitment across all swimming frequencies. The image above each trace shows a ventral root recording. (B) Plot of the instantaneous swim frequency (filled black circles) and membrane potential oscillation amplitude (filled red circles) for a slow V0d interneuron during a swim episode. Filled red circles denote swim cycles with recruitment. (C) Slow V0d interneurons showed large oscillation amplitudes across swim frequencies (1–3 Hz: n = 34 slow V0d interneurons; 4–6 Hz: n = 17 slow V0d interneurons; ∗p < 0.05; unpaired two-tailed Student’s t test). (D) Recordings of an intermediate V0d interneuron showing recruitment at intermediate frequencies (4–6 Hz). (E) Plot of the instantaneous swim frequency (filled black circles) and membrane potential oscillation amplitude (green circles) for an intermediate V0d interneuron during a swim episode. Filled green circles denote swim cycles with recruitment, and open green circles denote no recruitment. (F) Intermediate V0d interneurons showed large oscillation amplitudes in the intermediate frequency range (1–3 Hz: n = 29 intermediate V0d interneurons; 4–6 Hz: n = 23 intermediate V0d interneurons; ∗∗∗p < 0.0001; unpaired two-tailed Student’s t test). (G) Recordings of a fast V0d interneuron showing no recruitment at slow or intermediate frequencies. (H) Plot of the instantaneous swim frequency (filled black circles) and membrane potential oscillation amplitude (open blue circles) for a fast V0d interneuron during a swim episode. Open blue circles denote swim cycles with no recruitment. (I) Fast V0d interneurons showed small oscillation amplitudes in the slow and intermediate frequency ranges (1–3 Hz: n = 18 fast V0d interneurons; 4–6 Hz: n = 15 fast V0d interneurons; unpaired two-tailed Student’s t test). See also Figure S2. |
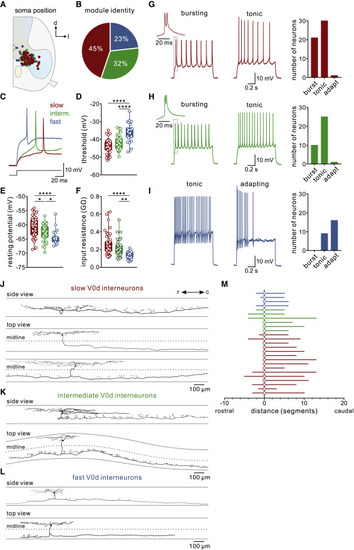
Figure 5. Intrinsic properties and morphologies of V0d interneuron subtypes in juvenile zebrafish (A) Plot of the soma position of recorded V0d interneurons showing no topographical organization of V0d interneuron subtypes. (B) Proportion of each V0d interneuron subtype identified among recorded neurons showing that the majority were slow or intermediate. (C) Recording showing a single action potential of slow, intermediate, and fast V0d interneurons. (D) Spike threshold was lowest for slow and highest for fast V0d interneurons (n = 52 slow V0d interneurons; n = 37 intermediate V0d interneurons; n = 26 fast V0d; ∗∗∗∗p < 0.0001; repeated-measures one-way ANOVA). (E) Resting membrane potential was most depolarized for slow and hyperpolarized for fast V0d interneurons (n = 52 slow V0d interneurons; n = 37 intermediate V0d interneurons; n = 26 fast V0d; ∗∗p < 0.01; ∗∗∗∗p < 0.0001; repeated-measures one-way ANOVA). (F) Input resistance was highest for slow and lowest for fast V0d interneurons (n = 52 slow V0d interneurons; n = 37 intermediate V0d interneurons; n = 26 fast V0d; ∗p < 0.05; ∗∗∗∗p < 0.0001; repeated-measures one-way ANOVA). (G) Left: example of a bursting and tonic slow V0d interneuron. Right: the proportion of each firing type among slow V0d interneurons. (H) Left: example of a bursting and tonic intermediate V0d interneuron. Right: the proportion of each firing type among intermediate V0d interneurons. (I) Left: example of a tonic and adapting fast V0d interneuron. Right: the proportion of each firing type among fast V0d interneurons. (J) Morphological reconstructions of neurobiotin-filled slow V0d interneurons. The top example shows a side view, and the bottom two examples show a top-down view to illustrate the commissural axon projection. The dashed line indicates the midline of the spinal cord. (K) Morphological reconstructions of neurobiotin-filled intermediate V0d interneurons. (L) Morphological reconstructions of neurobiotin-filled fast V0d interneurons. (M) Plot of the commissural axon projection direction and distances of the identified slow, intermediate, and fast V0d interneurons. |

Figure 6. A specialized V0d interneuron likely involved in escape (A) Soma position of dorsal specialized V0d interneurons in the spinal cord. Dorsal V0d interneurons were located dorso-medial close to the position of primary motoneurons. (B) Top: example morphological reconstruction of a dorsal V0d interneuron (side view). Bottom: the axon projection direction and distances of dorsal V0d interneurons. (C) Top: morphological reconstruction of a dorsal V0d interneuron (top down) showing the close proximity of the soma and contralateral axon with primary motoneurons (pMNs: indicated by gray-filled circles on the ipsilateral side and empty circles on the contralateral side). The dashed line indicates the spinal cord midline. Bottom: a side-view reconstruction of a dorsal V0d interneuron. Images below show the soma and the contralateral axon close to primary motoneurons in the regions indicated by red boxes. The white arrow indicates another dorsal V0d interneuron close to the axon of the contralateral recorded dorsal V0d interneuron. (D) Firing pattern of a dorsal V0d interneuron that is strongly adapting. (E) Dorsal V0d interneurons have a depolarized spike threshold and low input resistance relative to other V0d interneuron subtypes (n = 10 dorsal V0d interneurons). (F) Example recording of dorsal V0d interneuron during electrically evoked fictive swimming, which shows only small, subthreshold rhythmic oscillations of the membrane potential. |
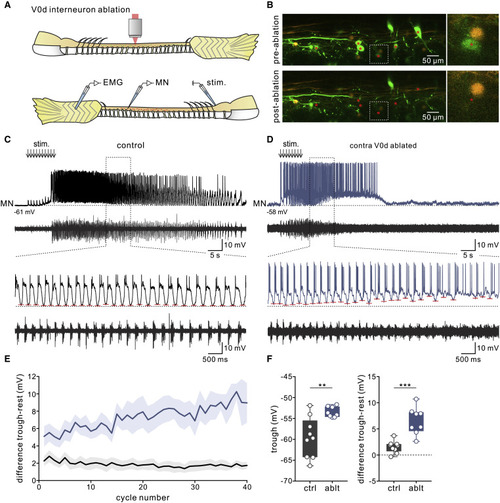
Figure 7. Ablation of V0d interneurons in juvenile zebrafish disrupts mid-cycle inhibition in motoneurons during slow fictive swimming (A) Experimental setup. Top: V0d interneurons were ablated along several segments on one side of the spinal cord. Bottom: recordings were then made from motoneurons on the opposite side of the spinal cord during swimming evoked by electrical stimulation. (B) Image of the spinal cord before (“pre-ablation”) and after (“post-ablation”) two-photon ablation of 20–40 V0d interneurons across approximately 5 spinal cord segments. (C) Recording of a control slow motoneuron during evoked fictive swimming in which mid-cycle inhibition silences motoneuron firing at each swim cycle. (D) Recording of a slow motoneuron during fictive swimming following the ablation of V0d interneurons. The mid-cycle inhibition becomes weaker and motoneuron firing becomes tonic as the swim episode progresses (red dashes indicate the peak of mid-cycle inhibition). (E) Pooled data showing the voltage difference between the trough value of mid-cycle inhibition and the resting membrane potential (mean and SEM; n = 9 control motoneurons from 7 separate animals; n = 8 motoneurons from 7 separate V0d-ablated animals). (F) Following the ablation of V0d interneurons, the value of mid-cycle inhibition in motoneurons became significantly more depolarized compared with control motoneurons (n = 9 control motoneurons from 7 separate animals; n = 8 motoneurons from 7 separate V0d-ablated animals; ∗∗p < 0.01; ∗∗∗p < 0.001; unpaired two-tailed Student’s t test). |