
- Title
-
iCodon customizes gene expression based on the codon composition
- Authors
- Diez, M., Medina-Muñoz, S.G., Castellano, L.A., da Silva Pescador, G., Wu, Q., Bazzini, A.A.
- Source
- Full text @ Sci. Rep.
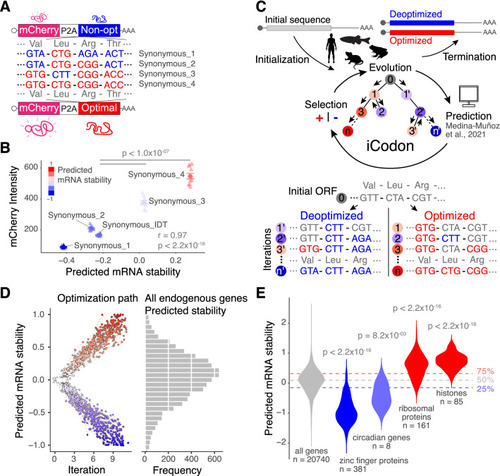
iCodon predicts gene expression based on the codon composition and designs new variants based on synonymous mutations. (A) Diagram of the synonymous reporters, differing only in synonymous mutations with different regulatory effects on mRNA stability. Each mRNA contains the coding sequence of mCherry fluorescent protein followed by a ribosome-skipping sequence (P2A) and a coding region that differs in the proportion of optimal and non-optimal codons but encodes the same peptide (synonymous mutations). (B) Scatter plot showing that fluorescence intensity of synonymous reporters in 293T transfected cells correlates with predicted mRNA stability (r = 0.97, p < 2.2 × 10⁻¹⁶, Pearson correlation test). n = 10 for all tested variants. (C) Diagram depicting the algorithm for codon optimization, iCodon: An initial coding sequence is provided by the user. Evolution: the algorithm generates variant sequences by introducing random synonymous mutations. Prediction: the machine learning model predicts the mRNA stability of each variant based on the codon composition. Selection: the algorithm selects the sequences with the highest or lowest mRNA stability depending on the direction of optimization. Iteration: this process is repeated multiple times producing an optimization path that generates a gradient in mRNA stability level. Illustrations by Mark Miller. (D) A random group of 50 human genes with predicted intermediate mRNA stability was selected and optimized and deoptimized by iCodon. The x-axis is the iteration number, and the y-axis is the predicted mRNA stability. The circles connected by a dash-line show the optimization or deoptimization path for each gene. The histogram on the right is the mRNA stability distribution for endogenous human genes. (E) Violin plot showing predictions of mRNA stability of selected groups of genes compared to all genes in the human transcriptome. The horizontal lines show the lower, middle and upper quartiles of the predicted mRNA stability of all genes. p values and number of genes (n) are indicated. |
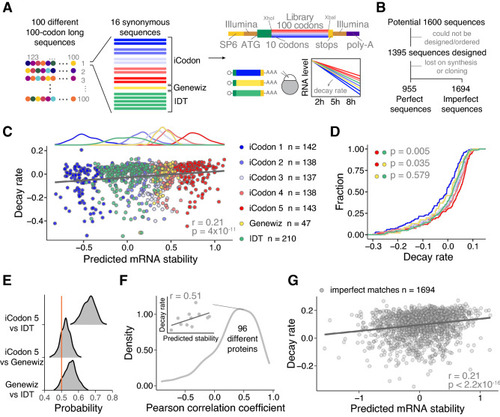
iCodon predicts the stability of thousands of injected mRNAs into zebrafish embryos. (A) Schematic of the reporter library. For 100 different 100-codons long proteins, 16 different coding sequences differing only in synonymous codons were designed. For each protein, 10 sequences were designed by iCodon in 5 bins with increasing predicted stability, 5 sequences by the method used by IDT and one for the Genewiz’s method. The sequences were ordered in bulk and cloned into the vector by restriction cloning with XhoI and XbaI, to generate transcripts sharing the same 5′ and 3′UTR containing Illumina adapters (copper) and 27 nt within the translation start site (green). In vitro transcribed mRNAs (SP6 promoter in yellow) were injected into 1-cell stage zebrafish embryos. Reporter mRNA library is analyzed at 2, 5, and 8 h post-injection. (B) Pipeline showing the steps to identify the designed reporter sequences (perfect) as well as non-designed sequences (imperfect). (C) Top: histogram displaying the frequency of predicted mRNA stability for each group of sequences. Bottom: Scatter plot showing a positive correlation between predicted mRNA stability and decay rate of injected mRNA reporters in zebrafish embryos (n = 955, r = 0.21, p = 4 × 10–11, Spearman correlation test). The colors indicate the method used to design the coding sequences. (D) Cumulative distributions of the decay rate of injected mRNAs reporters into zebrafish embryos designed with different methods (indicated by colors). iCodon 5 versus IDT p = 0.005, iCodon 5 versus Genewiz p = 0.035, and Genewiz versus IDT p = 0.579, unpaired, one-tailed t-test). (E) Histogram showing the probability to design the most stable mRNA for the 96 encoded proteins between the indicated methods. Orange line indicates a probability of 0.5. (F) Histogram showing the distribution of the Pearson correlation coefficients between the predicted mRNA stability and decay rate of injected mRNA synonymous reporters per protein. Inset shows the correlation between the predicted mRNA stability and decay rate of injected mRNA synonymous reporters for one protein as an example. (G) Scatter plot showing a positive correlation between predicted mRNA stability and decay rate of injected mRNA reporters in zebrafish embryos that did not match perfectly with the designed sequences but were observed in at least 2 replicates of each time point and encode for a protein longer than 70 codons (n = 1694, r = 0.21, p < 2.2 × 10⁻¹⁶, Spearman correlation test). |
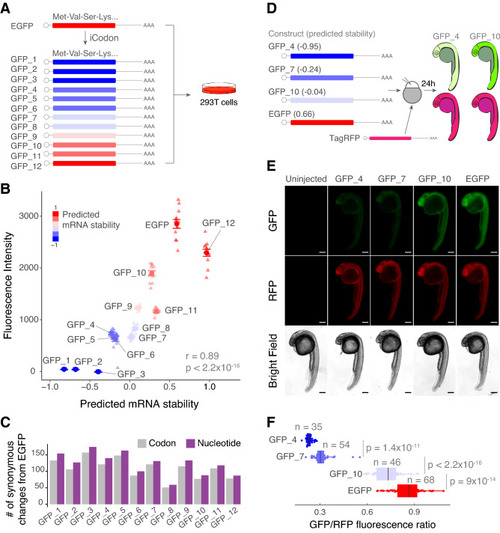
iCodon generates fluorescent variants with desired expression levels. (A) Illustration of 12 GFP variants generated by iCodon differing only in synonymous mutations and its predicted mRNA stability. All GFP variants were transfected in 293T cells and the fluorescence was measured by cytometry analysis. (B) Scatter plot showing a positive correlation between predicted mRNA stability and GFP fluorescence intensity in 293T transfected cells (r = 0.89, p < 2.2 × 10⁻¹⁶, Pearson correlation test). n = 12 for all tested variants. (C) Barplot displaying the number of codon (gray) or nucleotide (purple) changes in all 12 GFP variants compared to EGFP. (D) Four GFP variants were co-injected with TagRFP into 1-cell stage zebrafish embryos and imaged 24 h post injection (hpi). The mRNA stability predictions by iCodon in zebrafish are indicated in brackets. iCodon predictions are slightly different for zebrafish compared to humans as codon optimality is not identical between these two species. (E) Microscopy images of injected zebrafish embryos after 24 hpi. Scale bars represent 200 µm. (F) Quantification of the differences of fluorescence intensity of GFP relativized by RFP fluorescence from injected zebrafish embryos. p values and replicates (n) are indicated. |
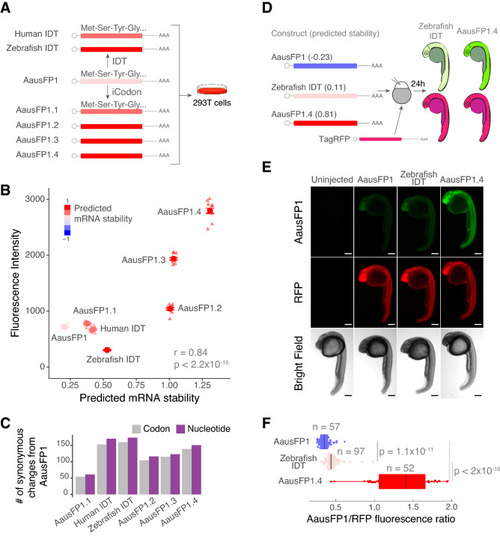
iCodon optimizes fluorescent AausFP1 variants for expression in vertebrates. (A) Diagram of the AausFP1 variants optimized by iCodon or by IDT Codon Optimization Tool that were transfected in 293T cells. (B) Scatter plot showing a positive correlation between predicted mRNA stability and AausFP1 fluorescence intensity in 293T transfected cells (r = 0.84, p < 2.2 × 10⁻¹⁶, Pearson correlation test). n = 12 for all tested variants. (C) Bar plot showing the number of codon (gray) or nucleotide (purple) changes in AausFP1 variants compared to the original sequence. (D) Three AausFP1 variants were co-injected with TagRFP into 1-cell stage zebrafish embryos and imaged 24 h post injection (hpi). The mRNA stability predictions by iCodon in zebrafish are indicated in brackets. (E) Microscopy images of injected zebrafish embryos after 24 hpi. Scale bars represent 200 µm. (F) Quantification of the differences of fluorescence intensity of AausFP1 relativized by RFP fluorescence from injected zebrafish embryos. p values and replicates (n) are indicated. |
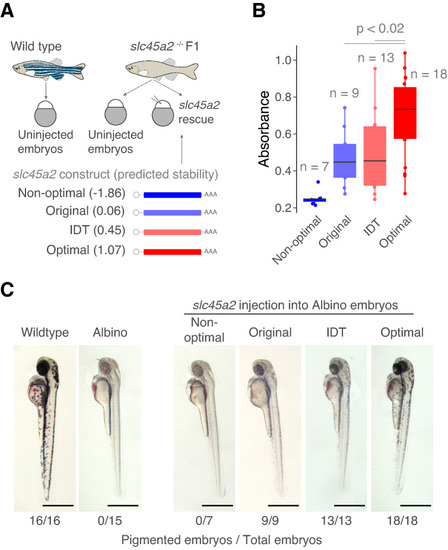
Optimized endogenous variant rescues loss-of-function phenotypes. (A) Schematic representation of the rescue experiment in zebrafish embryos. Variants of the slc452 gene (melanin pigmentation) were injected into loss-of-function slc45a2 knockout zebrafish embryos (albino phenotype, lack of pigmentation). The predicted mRNA stability of the variants is indicated. Illustrations by Mark Miller. (B) Quantification of the absorbance of the pigmentation as a measure of the amount of phenotype rescue. p values and replicates (n) are indicated. (C) Microscopy images of zebrafish embryos showing a degree of loss-of-pigmentation phenotype rescue by codon optimized variants compared to the albino fish. Wildtype embryo is shown in the left. Scale bars represent 700 µm. The numbers reflect the proportion of embryos that showed melanin pigmentation. |
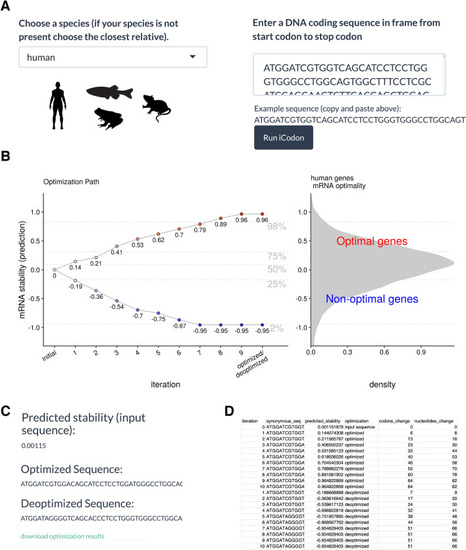
iCodon user steps. (A) The user needs to select between four species (human, mouse, zebrafish or Xenopus). The coding sequence (A, T, G and C) needs to be pasted into the box indicated and the Run iCodon box needs to be clicked. Illustrations by Mark Miller. (B) The scatter plot will show the original sequence in grey with its predicted stability. Each of the optimized (red) or deoptimized (blue) sequences with each respective stability score will be displayed. A histogram of the mRNA stability distribution of endogenous genes of the selected species is shown to use as a reference for the designed variants. (C) The original sequence, as well as all designed variant sequences, stability scores and nucleotide/codon changes with respect to the original sequence will be provided in a file by clinking “download optimization results”. (D) Example table of the downloaded iCodon results. |
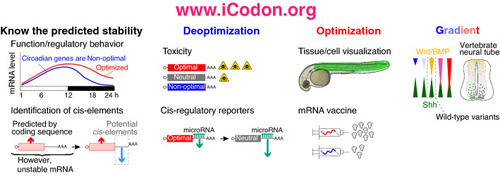
iCodon potential applications. iCodon can be used to uncover gene expression patters from the coding sequence; or to identify cis-regulatory elements. iCodon can be used to design sequences with neutral mRNA stability, these sequences will be more responsive to other regulatory elements (i.e., miR-430). Exogenous genes that are wanted to be expressed in a vertebrate model organism could result toxic for the cell; by designing coding sequences with a decreased expression, the toxicity level can be reduced. Tissue/cell visualization: fluorescent proteins found in another organism can be optimized for expression in vertebrate species. Injected mRNA (zebrafish embryos) or mRNA vaccine design can be codon optimized to increase the mRNA stability and expression. Expression gradient: iCodon has the potential to design a wide variety of coding sequences, which will show different gene expression patterns. |