
Fig. 6
- ID
- ZDB-FIG-220718-44
- Publication
- Diez et al., 2022 - iCodon customizes gene expression based on the codon composition
- Other Figures
- All Figure Page
- Back to All Figure Page
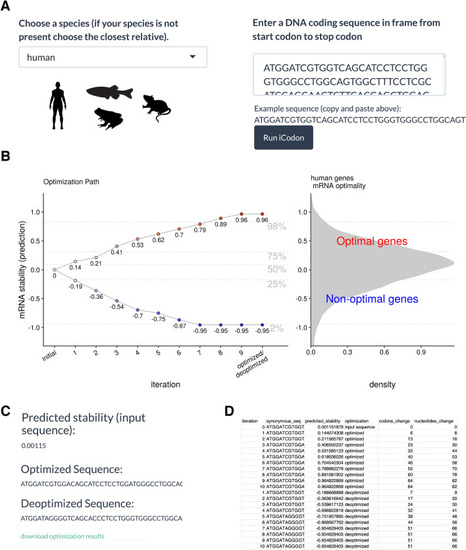
iCodon user steps. (A) The user needs to select between four species (human, mouse, zebrafish or Xenopus). The coding sequence (A, T, G and C) needs to be pasted into the box indicated and the Run iCodon box needs to be clicked. Illustrations by Mark Miller. (B) The scatter plot will show the original sequence in grey with its predicted stability. Each of the optimized (red) or deoptimized (blue) sequences with each respective stability score will be displayed. A histogram of the mRNA stability distribution of endogenous genes of the selected species is shown to use as a reference for the designed variants. (C) The original sequence, as well as all designed variant sequences, stability scores and nucleotide/codon changes with respect to the original sequence will be provided in a file by clinking “download optimization results”. (D) Example table of the downloaded iCodon results. |