
|
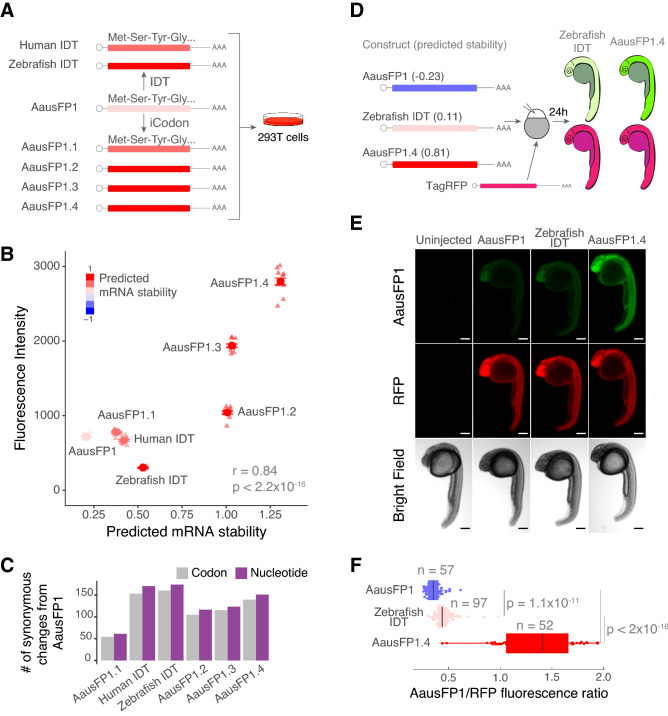
Fig. 4
iCodon optimizes fluorescent AausFP1 variants for expression in vertebrates. (A) Diagram of the AausFP1 variants optimized by iCodon or by IDT Codon Optimization Tool that were transfected in 293T cells. (B) Scatter plot showing a positive correlation between predicted mRNA stability and AausFP1 fluorescence intensity in 293T transfected cells (r = 0.84, p < 2.2 × 10⁻¹⁶, Pearson correlation test). n = 12 for all tested variants. (C) Bar plot showing the number of codon (gray) or nucleotide (purple) changes in AausFP1 variants compared to the original sequence. (D) Three AausFP1 variants were co-injected with TagRFP into 1-cell stage zebrafish embryos and imaged 24 h post injection (hpi). The mRNA stability predictions by iCodon in zebrafish are indicated in brackets. (E) Microscopy images of injected zebrafish embryos after 24 hpi. Scale bars represent 200 µm. (F) Quantification of the differences of fluorescence intensity of AausFP1 relativized by RFP fluorescence from injected zebrafish embryos. p values and replicates (n) are indicated.