
|
Fig. 3
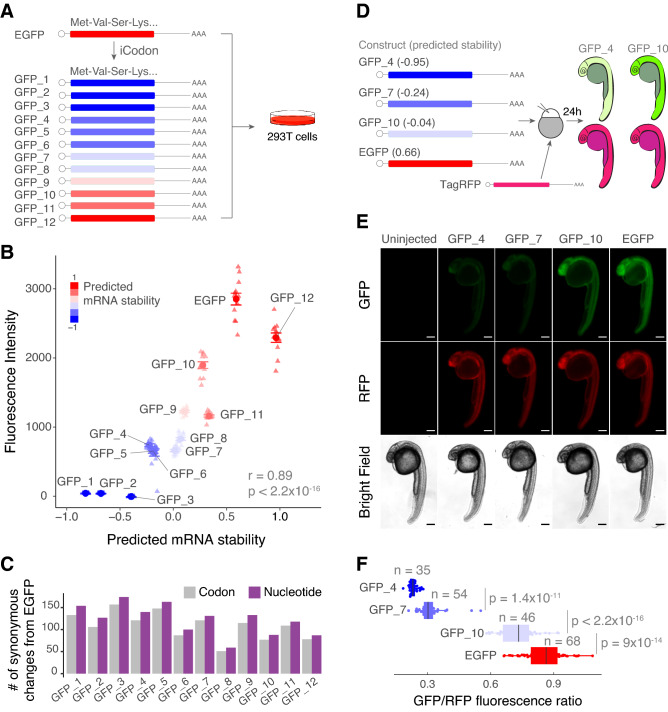
iCodon generates fluorescent variants with desired expression levels. (A) Illustration of 12 GFP variants generated by iCodon differing only in synonymous mutations and its predicted mRNA stability. All GFP variants were transfected in 293T cells and the fluorescence was measured by cytometry analysis. (B) Scatter plot showing a positive correlation between predicted mRNA stability and GFP fluorescence intensity in 293T transfected cells (r = 0.89, p < 2.2 × 10⁻¹⁶, Pearson correlation test). n = 12 for all tested variants. (C) Barplot displaying the number of codon (gray) or nucleotide (purple) changes in all 12 GFP variants compared to EGFP. (D) Four GFP variants were co-injected with TagRFP into 1-cell stage zebrafish embryos and imaged 24 h post injection (hpi). The mRNA stability predictions by iCodon in zebrafish are indicated in brackets. iCodon predictions are slightly different for zebrafish compared to humans as codon optimality is not identical between these two species. (E) Microscopy images of injected zebrafish embryos after 24 hpi. Scale bars represent 200 µm. (F) Quantification of the differences of fluorescence intensity of GFP relativized by RFP fluorescence from injected zebrafish embryos. p values and replicates (n) are indicated.