
Fig. 2
- ID
- ZDB-FIG-220718-40
- Publication
- Diez et al., 2022 - iCodon customizes gene expression based on the codon composition
- Other Figures
- All Figure Page
- Back to All Figure Page
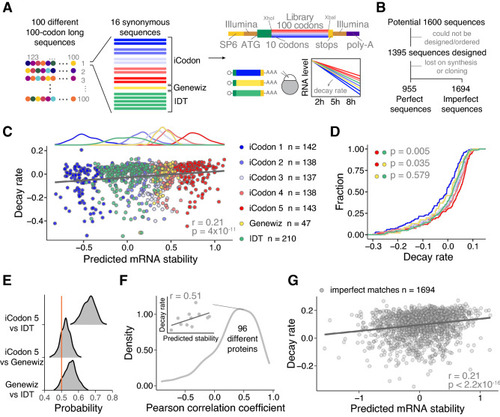
iCodon predicts the stability of thousands of injected mRNAs into zebrafish embryos. (A) Schematic of the reporter library. For 100 different 100-codons long proteins, 16 different coding sequences differing only in synonymous codons were designed. For each protein, 10 sequences were designed by iCodon in 5 bins with increasing predicted stability, 5 sequences by the method used by IDT and one for the Genewiz’s method. The sequences were ordered in bulk and cloned into the vector by restriction cloning with XhoI and XbaI, to generate transcripts sharing the same 5′ and 3′UTR containing Illumina adapters (copper) and 27 nt within the translation start site (green). In vitro transcribed mRNAs (SP6 promoter in yellow) were injected into 1-cell stage zebrafish embryos. Reporter mRNA library is analyzed at 2, 5, and 8 h post-injection. (B) Pipeline showing the steps to identify the designed reporter sequences (perfect) as well as non-designed sequences (imperfect). (C) Top: histogram displaying the frequency of predicted mRNA stability for each group of sequences. Bottom: Scatter plot showing a positive correlation between predicted mRNA stability and decay rate of injected mRNA reporters in zebrafish embryos (n = 955, r = 0.21, p = 4 × 10–11, Spearman correlation test). The colors indicate the method used to design the coding sequences. (D) Cumulative distributions of the decay rate of injected mRNAs reporters into zebrafish embryos designed with different methods (indicated by colors). iCodon 5 versus IDT p = 0.005, iCodon 5 versus Genewiz p = 0.035, and Genewiz versus IDT p = 0.579, unpaired, one-tailed t-test). (E) Histogram showing the probability to design the most stable mRNA for the 96 encoded proteins between the indicated methods. Orange line indicates a probability of 0.5. (F) Histogram showing the distribution of the Pearson correlation coefficients between the predicted mRNA stability and decay rate of injected mRNA synonymous reporters per protein. Inset shows the correlation between the predicted mRNA stability and decay rate of injected mRNA synonymous reporters for one protein as an example. (G) Scatter plot showing a positive correlation between predicted mRNA stability and decay rate of injected mRNA reporters in zebrafish embryos that did not match perfectly with the designed sequences but were observed in at least 2 replicates of each time point and encode for a protein longer than 70 codons (n = 1694, r = 0.21, p < 2.2 × 10⁻¹⁶, Spearman correlation test). |