
Fig. 1
- ID
- ZDB-IMAGE-220718-39
- Publication
- Diez et al., 2022 - iCodon customizes gene expression based on the codon composition
- All Figures
- Figures for Diez et al., 2022
|
Fig. 1
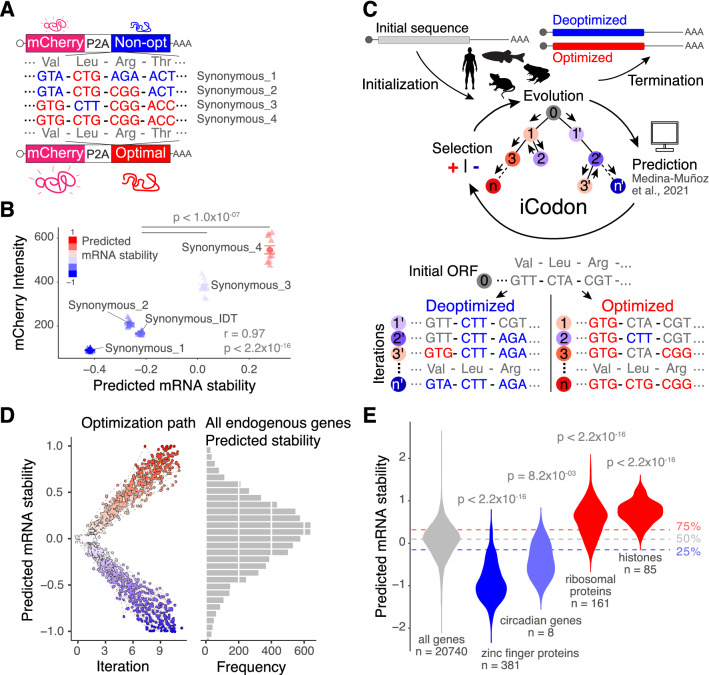
iCodon predicts gene expression based on the codon composition and designs new variants based on synonymous mutations. (A) Diagram of the synonymous reporters, differing only in synonymous mutations with different regulatory effects on mRNA stability. Each mRNA contains the coding sequence of mCherry fluorescent protein followed by a ribosome-skipping sequence (P2A) and a coding region that differs in the proportion of optimal and non-optimal codons but encodes the same peptide (synonymous mutations). (B) Scatter plot showing that fluorescence intensity of synonymous reporters in 293T transfected cells correlates with predicted mRNA stability (r = 0.97, p < 2.2 × 10⁻¹⁶, Pearson correlation test). n = 10 for all tested variants. (C) Diagram depicting the algorithm for codon optimization, iCodon: An initial coding sequence is provided by the user. Evolution: the algorithm generates variant sequences by introducing random synonymous mutations. Prediction: the machine learning model predicts the mRNA stability of each variant based on the codon composition. Selection: the algorithm selects the sequences with the highest or lowest mRNA stability depending on the direction of optimization. Iteration: this process is repeated multiple times producing an optimization path that generates a gradient in mRNA stability level. Illustrations by Mark Miller. (D) A random group of 50 human genes with predicted intermediate mRNA stability was selected and optimized and deoptimized by iCodon. The x-axis is the iteration number, and the y-axis is the predicted mRNA stability. The circles connected by a dash-line show the optimization or deoptimization path for each gene. The histogram on the right is the mRNA stability distribution for endogenous human genes. (E) Violin plot showing predictions of mRNA stability of selected groups of genes compared to all genes in the human transcriptome. The horizontal lines show the lower, middle and upper quartiles of the predicted mRNA stability of all genes. p values and number of genes (n) are indicated.