
- Title
-
DNA-damage induced cell death in yap1;wwtr1 mutant epidermal basal cells
- Authors
- Lai, J.K.H., Toh, P.J.Y., Cognart, H.A., Chouhan, G., Saunders, T.E.
- Source
- Full text @ Elife
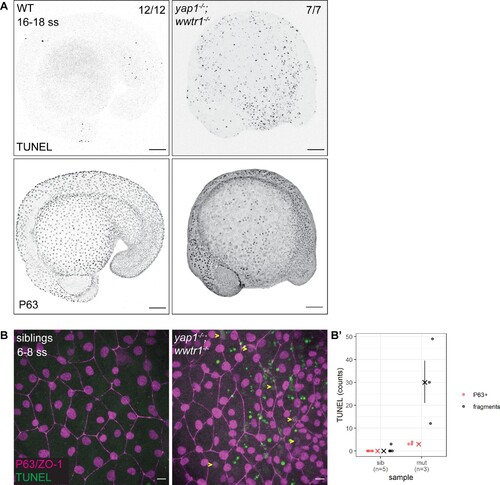
(A) Maximum intensity projections of 16–18 ss WT and mutant embryos stained with TUNEL and P63. Scale bars, 100 µm. (B) Maximum intensity projections of the epidermis on the lateral yolk of 6–8 ss mutant and normal siblings stained with TUNEL, P63, and ZO-1. Yellow arrowheads indicate TUNEL and P63 double positive nuclei. Scale bars, 10 µm. (B’) Quantification of TUNEL-positive EBC nuclei (P63+) and apoptotic fragments (fragments).
|
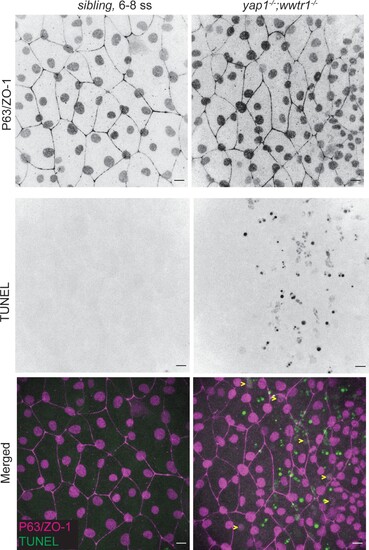
Scale bars 10 µm. Individual channels used to generate Figure 1B. |

(A) Maximum intensity projections of the epidermis on the lateral yolk stained with P63, and Wwtr1 or Yap1 antibodies at indicated developmental stages. Insets, demarcated in red, show overlay of P63 and Yap1/Wwtr1. Arrowheads – P63-positive basal cells; arrows – peridermal cells; triangles – peridermal cell junctions. Scale bars, 10 µm. (B) Boxplots of normalized intensities of Yap1 and Wwtr1 in the nucleus of P63-positive and P63-negative cells in the basal epidermis. t-Tests were carried out to compare these intensities between the two groups. ***p<0.001.
|
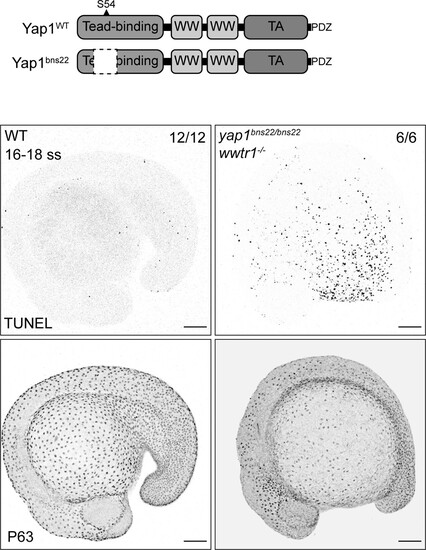
(Top) Schematic of the encoded protein product of the zebrafish yap1 WT and bns22 alleles. S54 is necessary for Yap1 binding to Teads. (Bottom) Maximum intensity projections of 16–18 ss WT and yap1bns22/bns22;wwtr1-/- embryos stained with TUNEL and P63. Scale bars, 100 µm. |
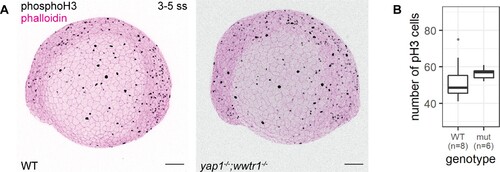
(A) Maximum intensity projections of 3–5 ss WT and mutant embryos stained with a proliferation marker, phospho-histone H3 (phosphoH3; pH3), and phalloidin. Scale bars, 100 µm. (B) Boxplot of the number of pH3 cells on the lateral side of the yolk of WT and mutant zebrafish embryos. mut – yap1;wwtr1 double mutants.
|
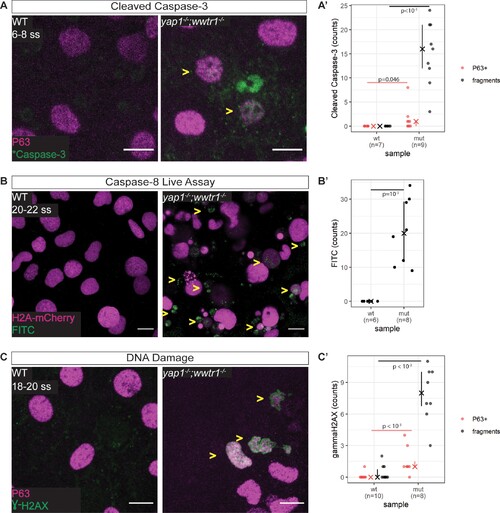
(A) Maximum intensity projections of 6–8 ss WT and mutant epidermis on the lateral yolk stained with cleaved Caspase-3 (*Caspase-3) and P63. Some *Caspase-3-positive cells are also P63-positive (yellow arrowheads). Scale bars, 10 µm. (A’) Number of epidermal basal cells (EBCs) (P63+) and apoptotic fragments (fragments) expressing cleaved Caspase-3 in WT and mutant embryo epidermis. ‘X’ represents the median, while the whiskers projecting from it represent the interquartile range. (B) Maximum intensity projections of the epidermis on the lateral yolk of 20–22 ss WT and mutant embryos expressing H2A-mCherry. Embryos were incubated in a Caspase-8 chemical probe, FITC-IETD-FMK, prior to imaging. FITC signal indicates Caspase-8 activity in cells (yellow arrowheads). Scale bars, 10 µm. (B’) Number of FITC foci in WT and mutant embryo epidermis. ‘X’ represents the median, while the whiskers projecting from it represent the interquartile range. (C) Maximum intensity projections of 18–22 ss WT and mutant epidermis on the lateral yolk stained with γH2AX and P63. Some nuclei are positive for both markers (yellow arrowheads). Scale bars, 10 µm. (C’) Number of EBCs (P63+) and apoptotic fragments (fragments) expressing γH2AX in WT and mutant embryo epidermis. ‘X’ represents the median, while the whiskers projecting from it represent the interquartile range.
|
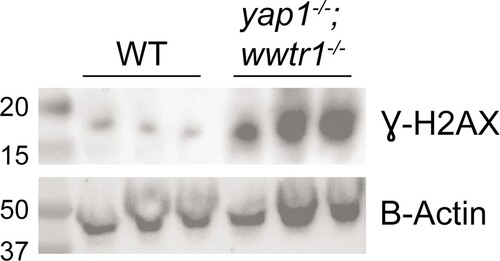
Western blot of γH2AX and B-actin (loading control). Each lane is a biological replicate of pooled 18–20 ss WT and mutant embryos. Ladder on far left lane with annotated size (in kD). |
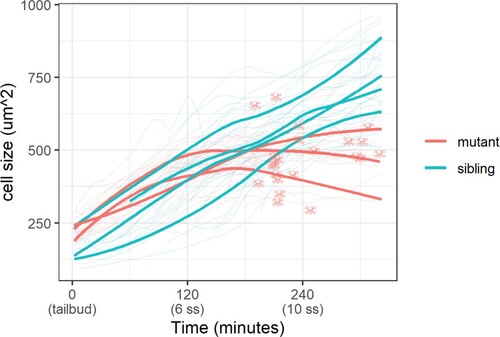
Cell size was measured with a membrane marker during live imaging of mutant and sibling embryos from the tailbud stage. Fine lines are the size of individual cells, while bold lines are the average cell size in a single embryo. Skull symbols mark cell size and time before death (DNA condensation).
|
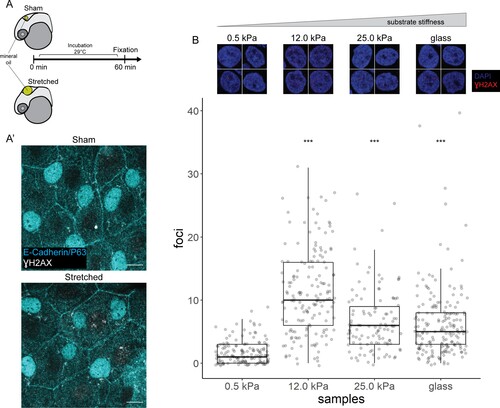
(A) Schematic of head epidermal cell stretching experiment in zebrafish embryos. (A’) Sham (n=6) and stretched (n=6) head epidermal cells stained with γH2AX and epidermal markers (E-cadherin and P63). P63 is a marker for epidermal basal cells (EBCs). No discernible γH2AX signal was detected in both conditions. Scale bars, 10 µm. (B) Selected nuclei of HaCaT cells cultured on 0.5, 12.0, 25.0 kPa hydrogels and glass, as well as boxplot of the number of γH2AX foci in these nuclei. Number of γH2AX foci in HaCaT cell nuclei were contrasted against HaCaT cells cultured on 0.5 kPa hydrogel using t-tests. Data were collected from three independent experiments. ***p<0.001 adjusted for multiple testing (Tukey method).
|
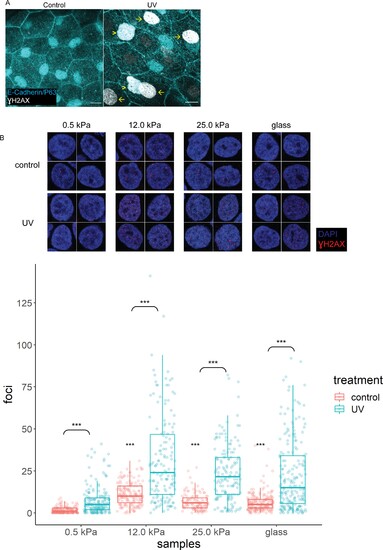
(A) Control (n=5) and UV-treated (n=4) head epidermal cells of zebrafish embryos stained with γH2AX and epidermal markers (E-cadherin and P63). P63 is a marker for epidermal basal cells (EBCs). EBCs (yellow arrowheads) and peridermal cells (yellow arrows) exposed to UV exhibit pan-nuclear γH2AX. (B) Selected nuclei of control and UV-treated HaCaT cells cultured on 0.5, 12, 25 kPa hydrogels and glass, and boxplots of the number of γH2AX foci in these nuclei. t-Tests on control groups were compared against control HaCaT cells cultured on 0.5 kPa hydrogel. t-Tests on UV groups were compared against their respective controls (brackets). Data were collected from three independent experiments. ***p<0.001 adjusted for multiple testing.
|
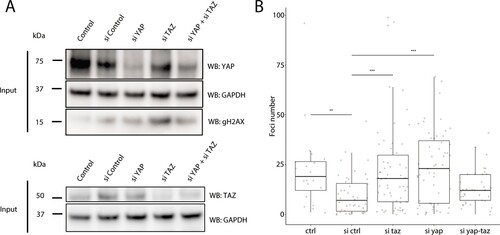
(A) Western blots of control and YAP1/WWTR1 knockdown HaCaT cells. (B) Boxplot of the number of γH2AX foci in control and YAP1/WWTR1 knockdown HaCaT cell nuclei. Number of γH2AX were compared to control knockdowns (sictrl) using t-tests.
|