
|
Fig. 3
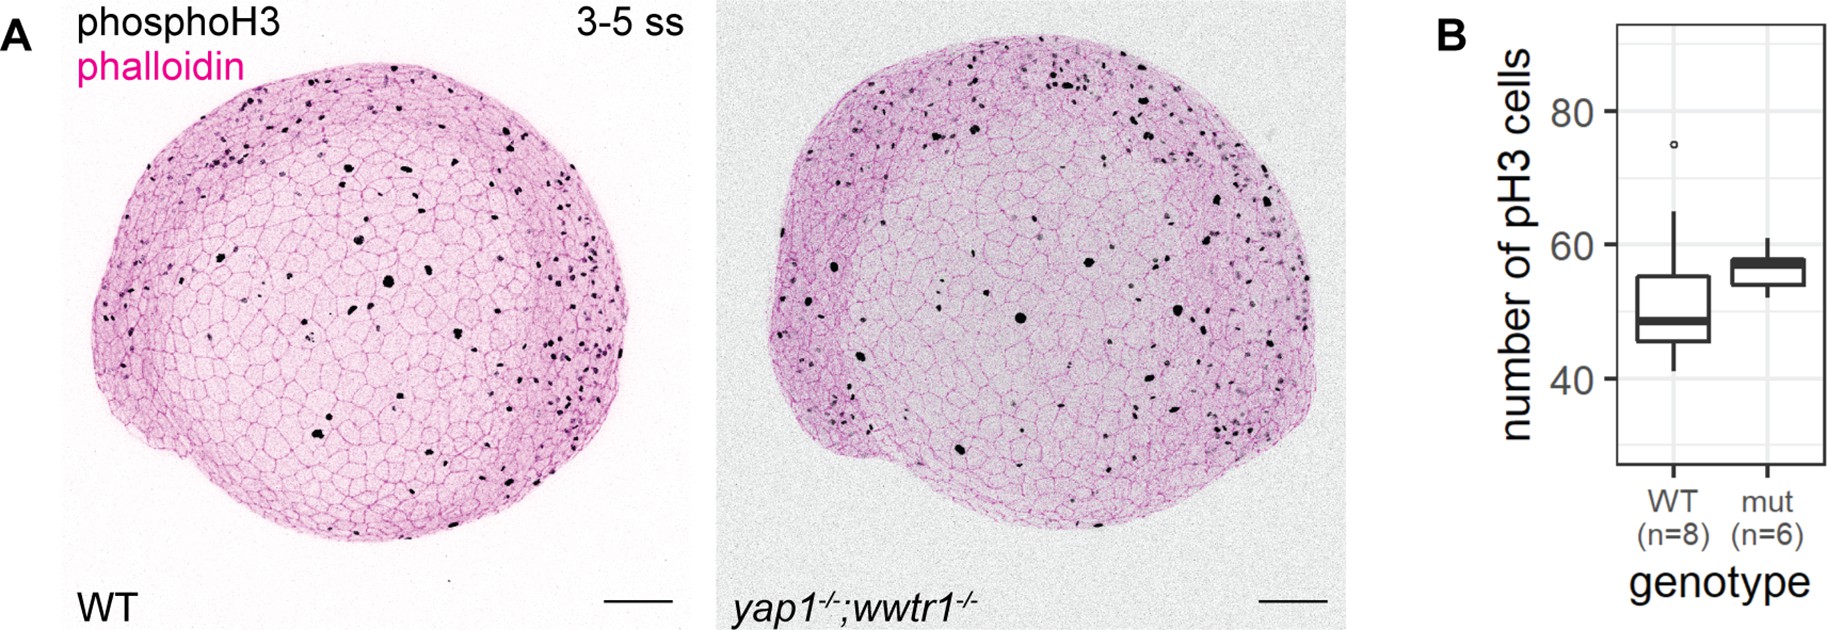
(A) Maximum intensity projections of 3–5 ss WT and mutant embryos stained with a proliferation marker, phospho-histone H3 (phosphoH3; pH3), and phalloidin. Scale bars, 100 µm. (B) Boxplot of the number of pH3 cells on the lateral side of the yolk of WT and mutant zebrafish embryos. mut – yap1;wwtr1 double mutants.
Concurrent loss of yap1 and wwtr1 did not impair epidermal cell proliferation.