
|
Fig. 6
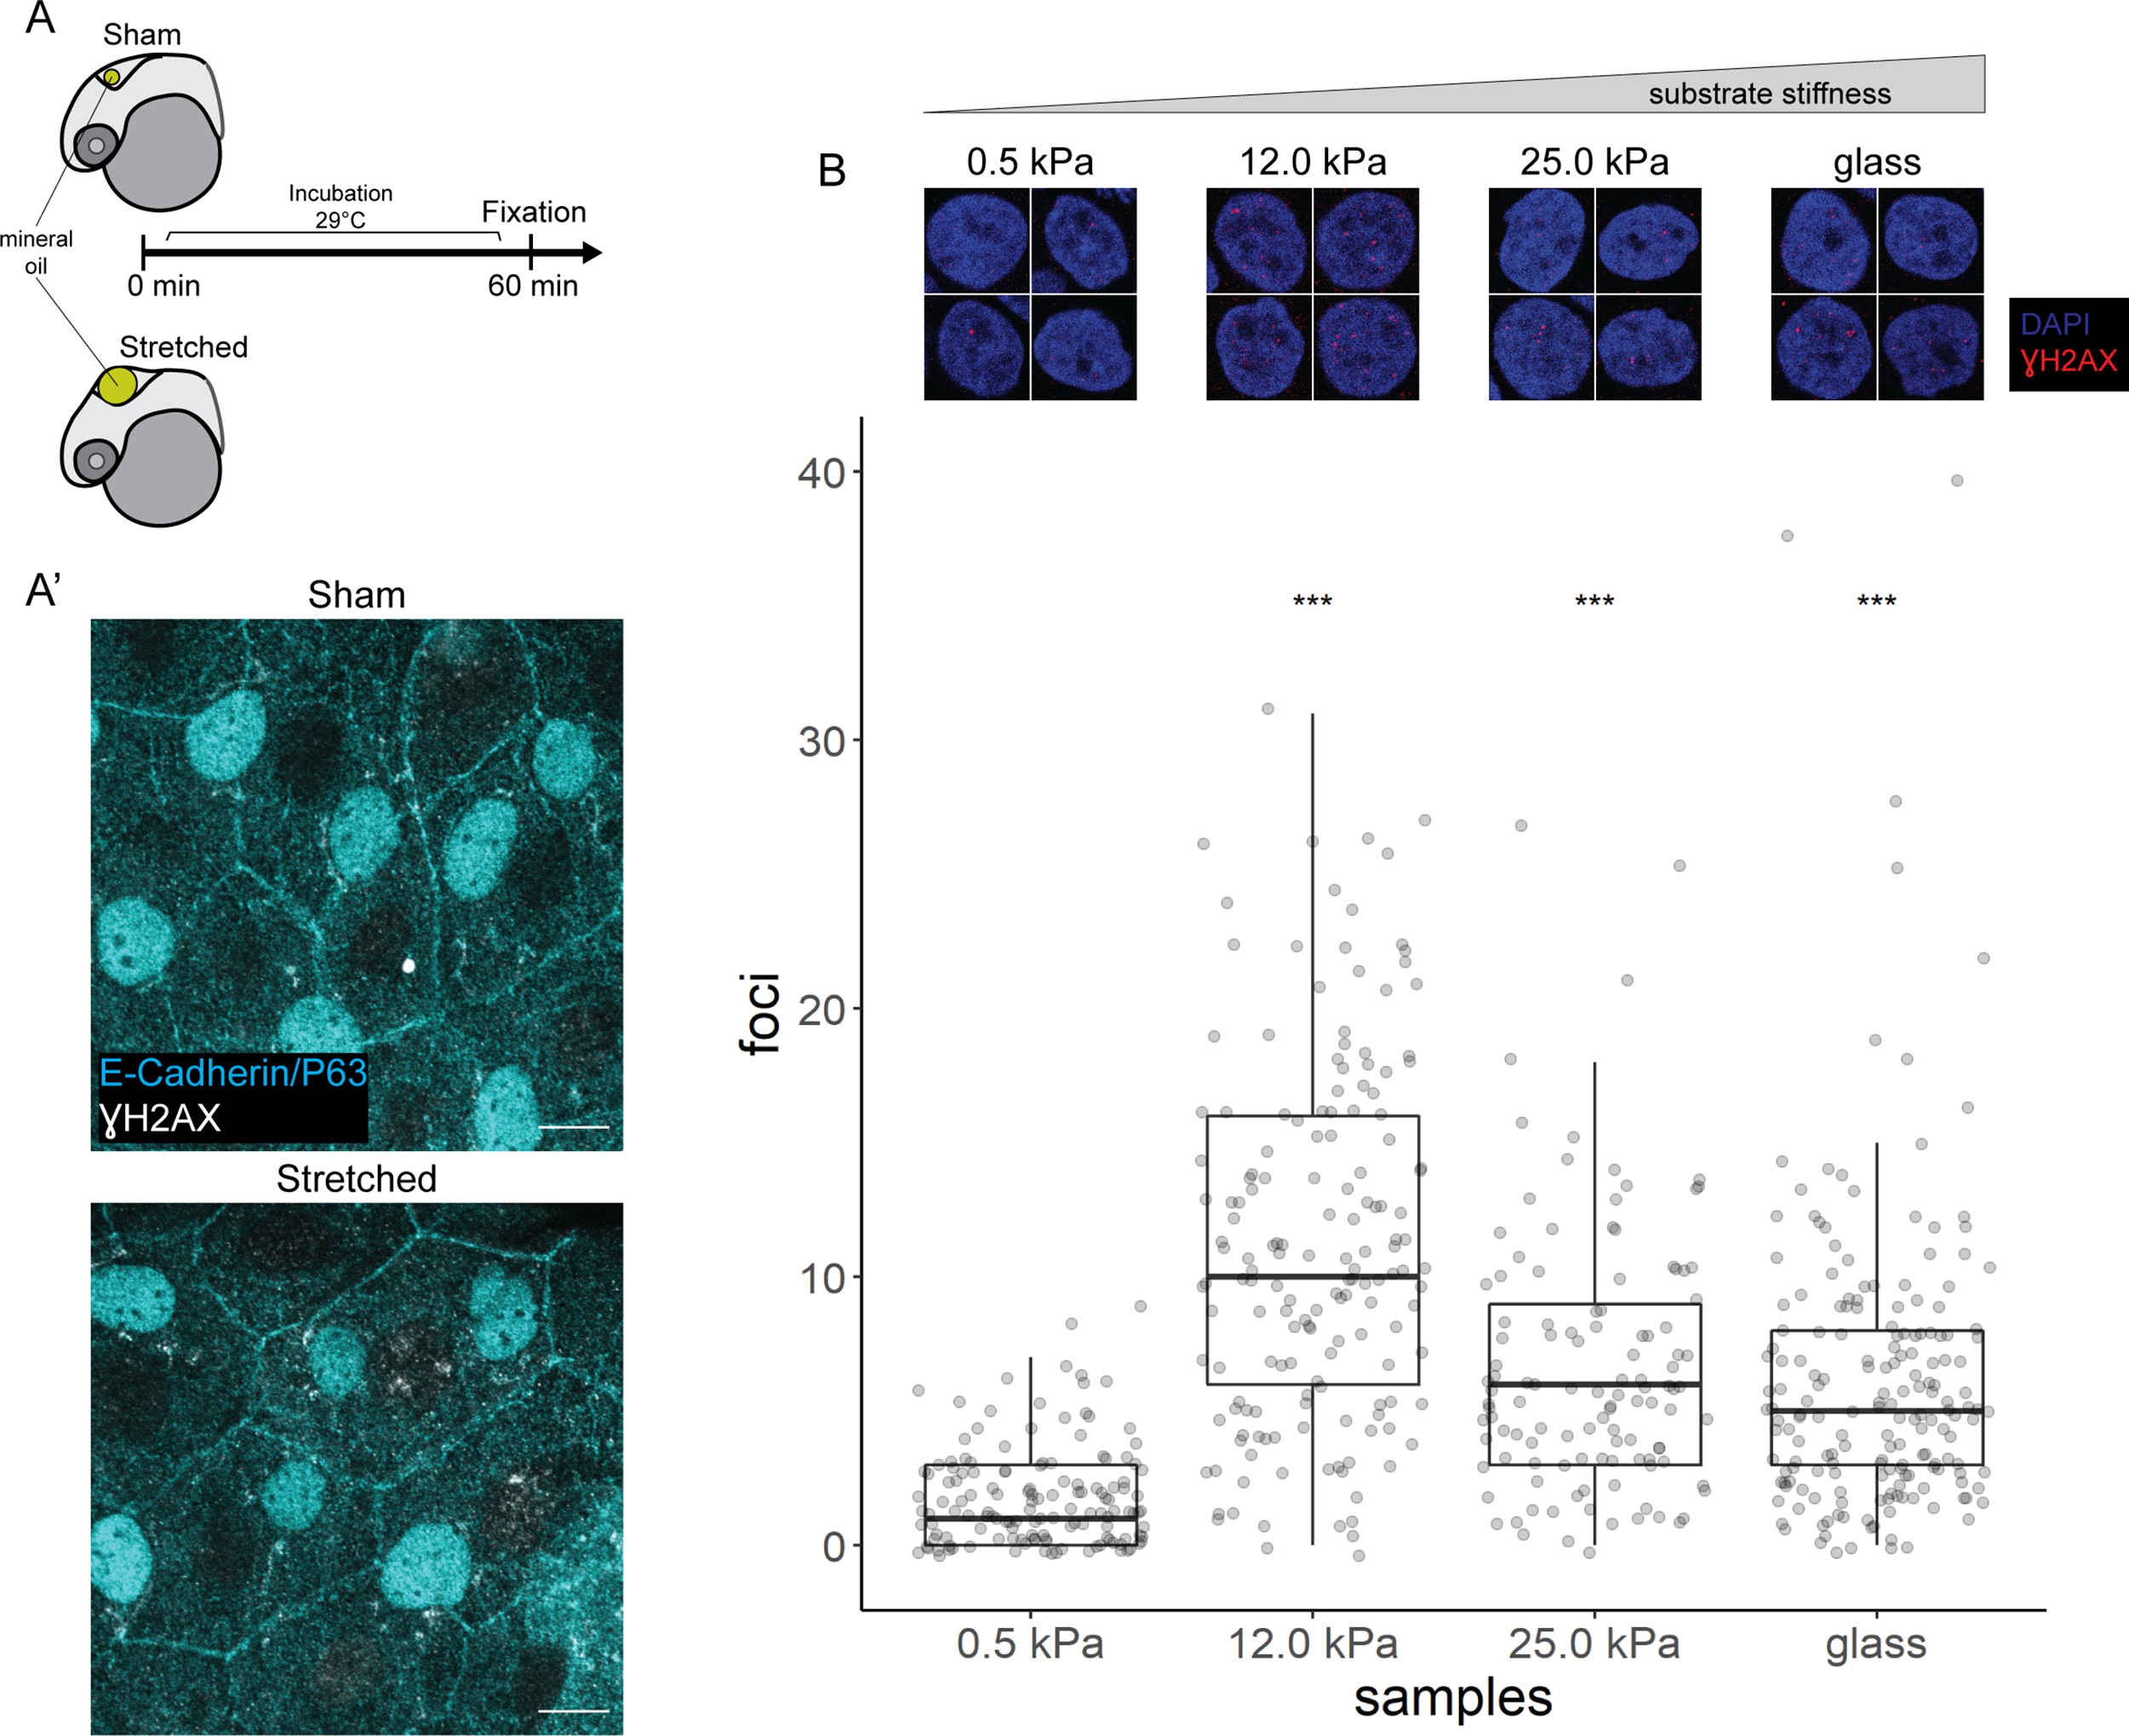
(A) Schematic of head epidermal cell stretching experiment in zebrafish embryos. (A’) Sham (n=6) and stretched (n=6) head epidermal cells stained with γH2AX and epidermal markers (E-cadherin and P63). P63 is a marker for epidermal basal cells (EBCs). No discernible γH2AX signal was detected in both conditions. Scale bars, 10 µm. (B) Selected nuclei of HaCaT cells cultured on 0.5, 12.0, 25.0 kPa hydrogels and glass, as well as boxplot of the number of γH2AX foci in these nuclei. Number of γH2AX foci in HaCaT cell nuclei were contrasted against HaCaT cells cultured on 0.5 kPa hydrogel using t-tests. Data were collected from three independent experiments. ***p<0.001 adjusted for multiple testing (Tukey method).
γH2AX in stretched epidermal cells and in keratinocytes cultured on different substrate stiffness.