
FIGURE
Fig. 3
- ID
- ZDB-FIG-220617-8
- Publication
- Lai et al., 2022 - DNA-damage induced cell death in yap1;wwtr1 mutant epidermal basal cells
- Other Figures
- All Figure Page
- Back to All Figure Page
Fig. 3
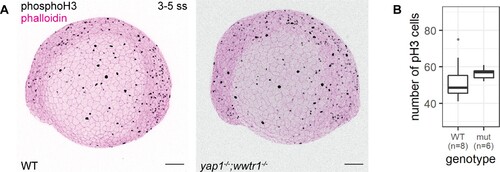
(A) Maximum intensity projections of 3–5 ss WT and mutant embryos stained with a proliferation marker, phospho-histone H3 (phosphoH3; pH3), and phalloidin. Scale bars, 100 µm. (B) Boxplot of the number of pH3 cells on the lateral side of the yolk of WT and mutant zebrafish embryos. mut – yap1;wwtr1 double mutants.
|
Expression Data
Expression Detail
Antibody Labeling
Phenotype Data
| Fish: | |
|---|---|
| Observed In: | |
| Stage: | 1-4 somites |
Phenotype Detail
Acknowledgments
This image is the copyrighted work of the attributed author or publisher, and
ZFIN has permission only to display this image to its users.
Additional permissions should be obtained from the applicable author or publisher of the image.
Full text @ Elife