
- Title
-
Endoglin Modulates TGFβR2 Induced VEGF and Proinflammatory Cytokine Axis Mediated Angiogenesis in Prolonged DEHP-Exposed Breast Cancer Cells
- Authors
- Jadhao, M., Chen, C.L., Liu, W., Deshmukh, D., Liao, W.T., Chen, J.Y., Urade, R., Tsai, E.M., Hsu, S.K., Wang, L.F., Chiu, C.C.
- Source
- Full text @ Biomedicines
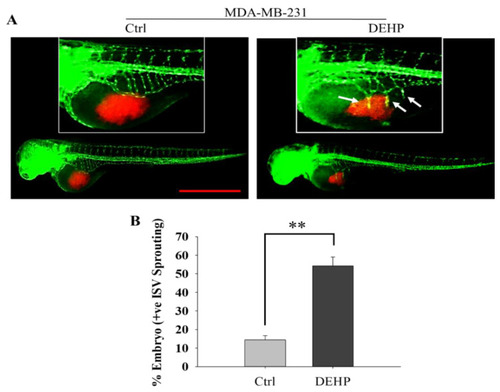
Representative and quantitative results of the zebrafish xenograft angiogenesis assay. (A) DEHP-exposed MDA-MB-231 cells enhance SIV sprouting in Tg (fli1: EGFP) zebrafish embryos at 24 hpi. Red fluorescence: DiI stained breast cancer cells; Green fluorescence: vascular network of zebrafish embryo. Scale bar = 1000 µm. White arrow: Indicate site of SIV sprouting. (B) Quantitative results of angiogenesis in zebrafish showing SIV sprouting (n = 50); ** p < 0.001. |
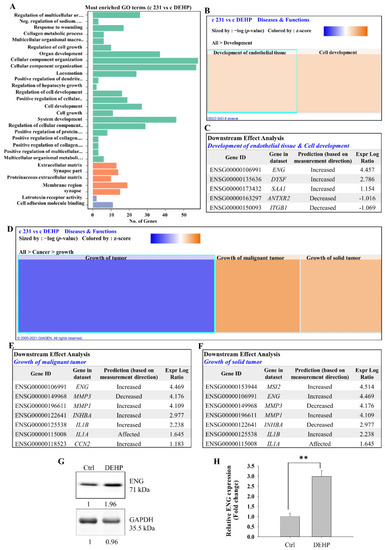
Representative results of RNA sequencing and IPA of control and DEHP-treated MDA-MB-231 cells. (A) Bar chart of significantly enriched GO terms and the number of DEGs enriched in biological processes (green), cellular components (orange), and molecular function (violet). (B) IPA-derived heatmap analysis of development under cellular diseases and functions of the DEGs involved. (C) Downstream analysis of genes involved in the development of endothelial tissue and cell development. (D) IPA-derived heatmap analysis of cancer growth under cellular diseases and functions of the DEGs involved. (E,F) Downstream analysis of genes involved in the growth of malignant tumors and the growth of solid tumors in control and DEHP-exposed MDA-MB-231 cells, highlighting the involvement of endoglin/CD105 and its prediction as a regulator of DEHP-induced angiogenesis. (G,H) Prolonged DEHP exposure increased endoglin expression at the protein and mRNA level in MDA-MB-231 cells; ** p < 0.001. |
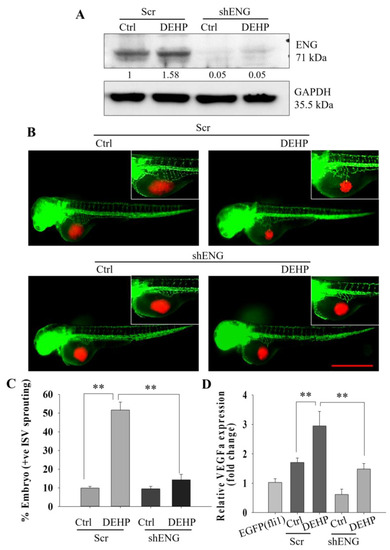
Representative and quantitative results showing that DEHP-induced endoglin-controlled VEGFA-mediated angiogenesis in vivo. (A) Prolonged DEHP treatment upregulated endoglin expression in MDA-MB-231 cells, and shENG treatment depleted endoglin expression in control and DEHP-exposed MDA-MB-231 cells. (B) Endoglin knockdown reduced DEHP-induced SIV sprouting in Tg (fli1: EGFP) zebrafish embryos at 24 hpi. Scale bar =1000 µm. (C) Quantitative results of angiogenesis showing a reduced number of zebrafish embryos showing SIV sprouting following endoglin knockdown (n = 50). (D) Depletion of VEGFA mRNA levels in zebrafish embryos following endoglin knockdown cell xenografts of DEHP-exposed MDA-MB-231 cells; ** p < 0.001. |

Representative and quantitative results of endoglin-mediated HUVEC tube formation. (A) Induced HUVEC tube formation in coculture with control and DEHP-exposed MDA-MB-231 cells at 8 h after seeding; endoglin knockdown reversed DEHP-induced HUVEC tube formation. Scale bar = 250 µm. (B) Quantitative evaluation of the number of tubes formed in coculture at 8 h after cell seeding. (C) Quantitative evaluation of average tube length in coculture at 8 h after cell seeding. (D) Quantitative evaluation of the number of nodes formed in coculture at 8 h after cell seeding. (E) Results of quantitative ELISA for VEGF levels in the cell culture medium of control and DEHP-exposed MDA-MB-231 cells (mock- and shENG-treated); ** p < 0.001. |
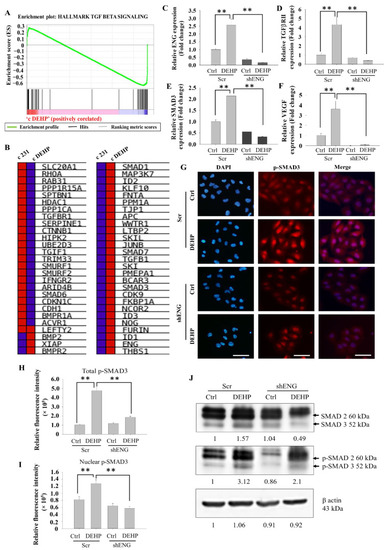
Representative and quantitative results of endoglin-mediated regulation of the TGFβ/SMAD3/VEGF signaling axis. (A) GSEA of TGFβ signaling showing a positive correlation with DEHP-treated MDA-MB-231 cells (enrichment score). (B) Blue–Pink O’ gram showing core enrichment of individual genes in the TGFβ signaling gene set (red: upregulation; blue: downregulation). (C–F) qPCR analysis showing the mRNA expression of endoglin, TGFβRII, SMAD3, and VEGF in control and DEHP-exposed MDA-MB-231 cells (mock- and shENG-treated). (G) IF results showing expression changes and nuclear localization of p-SMAD3. Scale bar = 100 µm. (H,I) Quantitative analysis of p-SMAD3 IF showing total and nuclear p-SMAD3 expression levels. (J) SMAD3 and phospho-SMAD3 expression evaluated by Western blotting; ** p < 0.001. |
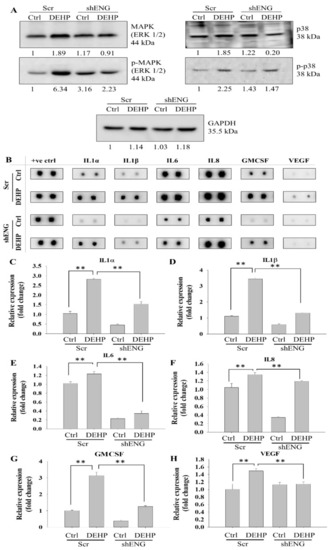
Representative and quantitative results of endoglin-mediated MAPK/p38 signaling and cytokine regulation. (A) Western blotting results showing upregulation of MAPK, phospho-MAPK, p38, and phospho-p38 in DEHP-treated MDA-MB-231 cells, and endoglin reversed protein expression. (B) Representative results of the antibody angiogenesis array showing endoglin-mediated expression of the inflammatory cytokines GMCSF and VEGF. (C–H) Quantification of the expression of IL1α, IL1β, IL6, IL8, GMCSF, and VEGF in control and DEHP-exposed MDA-MB-231 cells (mock- and shENG-treated). +ve ctrl: positive control; ** p < 0.001. |

Schematic representation of prolonged DEHP exposure-induced angiogenesis potential in breast cancer cells. Prolonged DEHP exposure at physiological concentrations upregulate the expression of endoglin (ENG). Endoglin overexpression activates TGFβ and MAPK/p38 signaling-mediated production of VEGF; inflammatory cytokines IL1α, IL1β, IL6, IL8; and GMCSF, contributing to enhanced DEHP-induced angiogenesis potential in breast cancer cells. shRNA mediated ENG knockdown reversed ENG induced angiogenesis through downregulation of TGFβ and MAPK/p38 signaling along with reduced expression of inflammatory cytokines IL1α, IL1β, IL6, IL8; and GMCSF. |