
|
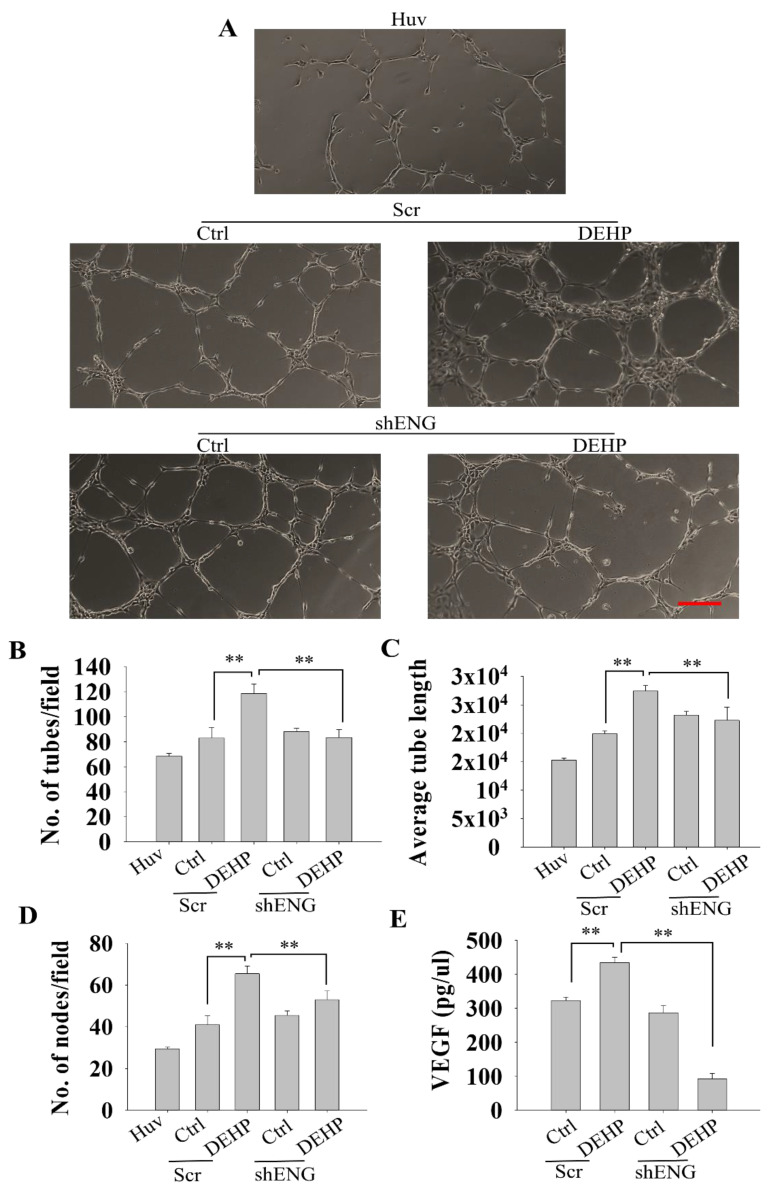
Figure 4 Representative and quantitative results of endoglin-mediated HUVEC tube formation. (A) Induced HUVEC tube formation in coculture with control and DEHP-exposed MDA-MB-231 cells at 8 h after seeding; endoglin knockdown reversed DEHP-induced HUVEC tube formation. Scale bar = 250 µm. (B) Quantitative evaluation of the number of tubes formed in coculture at 8 h after cell seeding. (C) Quantitative evaluation of average tube length in coculture at 8 h after cell seeding. (D) Quantitative evaluation of the number of nodes formed in coculture at 8 h after cell seeding. (E) Results of quantitative ELISA for VEGF levels in the cell culture medium of control and DEHP-exposed MDA-MB-231 cells (mock- and shENG-treated); ** p < 0.001.