
|
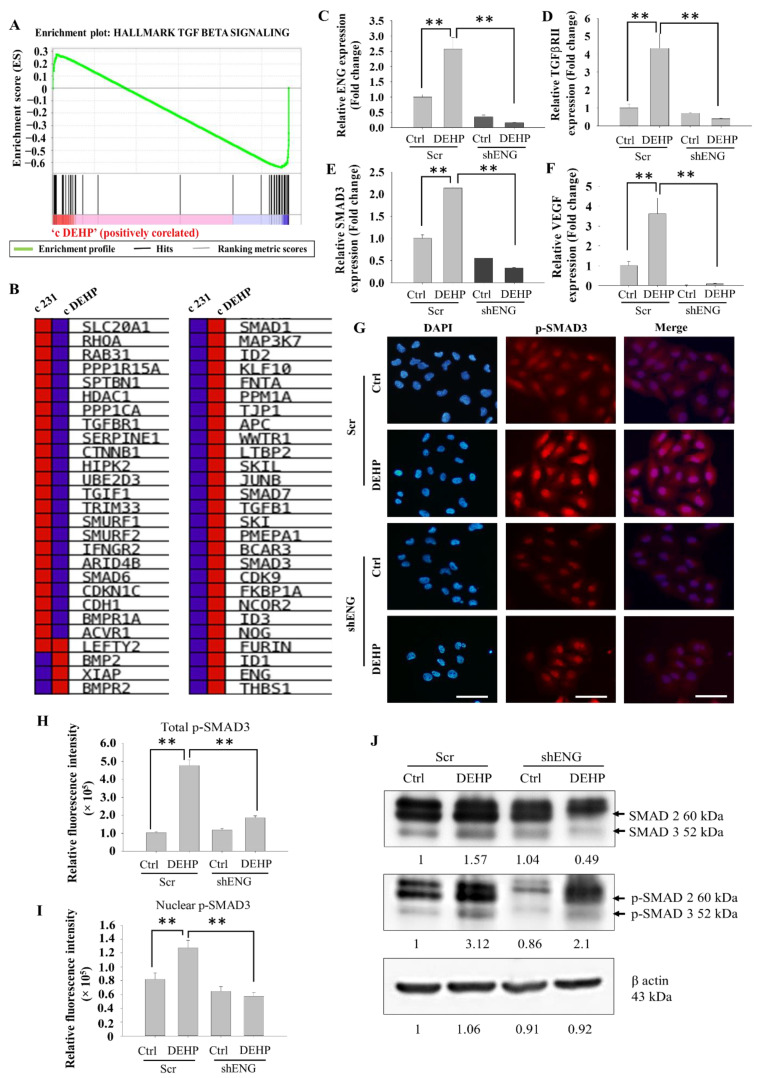
Figure 5 Representative and quantitative results of endoglin-mediated regulation of the TGFβ/SMAD3/VEGF signaling axis. (A) GSEA of TGFβ signaling showing a positive correlation with DEHP-treated MDA-MB-231 cells (enrichment score). (B) Blue–Pink O’ gram showing core enrichment of individual genes in the TGFβ signaling gene set (red: upregulation; blue: downregulation). (C–F) qPCR analysis showing the mRNA expression of endoglin, TGFβRII, SMAD3, and VEGF in control and DEHP-exposed MDA-MB-231 cells (mock- and shENG-treated). (G) IF results showing expression changes and nuclear localization of p-SMAD3. Scale bar = 100 µm. (H,I) Quantitative analysis of p-SMAD3 IF showing total and nuclear p-SMAD3 expression levels. (J) SMAD3 and phospho-SMAD3 expression evaluated by Western blotting; ** p < 0.001.