
|
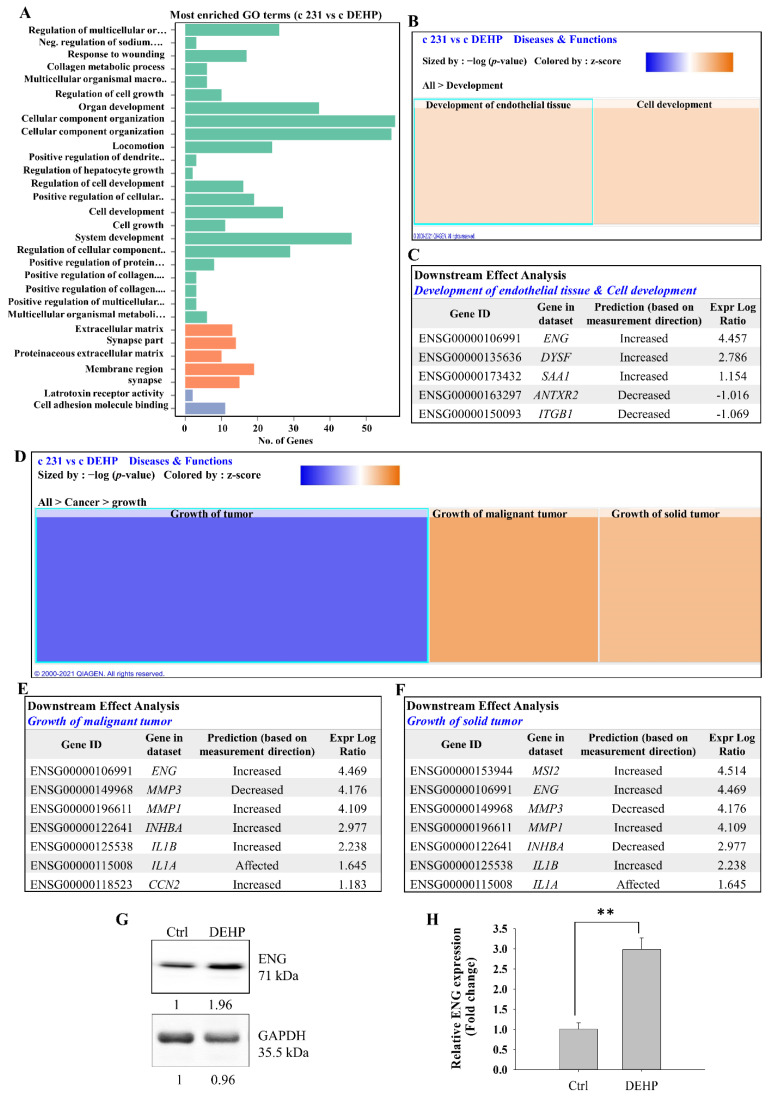
Figure 2 Representative results of RNA sequencing and IPA of control and DEHP-treated MDA-MB-231 cells. (A) Bar chart of significantly enriched GO terms and the number of DEGs enriched in biological processes (green), cellular components (orange), and molecular function (violet). (B) IPA-derived heatmap analysis of development under cellular diseases and functions of the DEGs involved. (C) Downstream analysis of genes involved in the development of endothelial tissue and cell development. (D) IPA-derived heatmap analysis of cancer growth under cellular diseases and functions of the DEGs involved. (E,F) Downstream analysis of genes involved in the growth of malignant tumors and the growth of solid tumors in control and DEHP-exposed MDA-MB-231 cells, highlighting the involvement of endoglin/CD105 and its prediction as a regulator of DEHP-induced angiogenesis. (G,H) Prolonged DEHP exposure increased endoglin expression at the protein and mRNA level in MDA-MB-231 cells; ** p < 0.001.