
- Title
-
The polarity protein Par3 coordinates positively self-renewal and negatively invasiveness in glioblastoma
- Authors
- Dadras, M.S., Caja, L., Mezheyeuski, A., Liu, S., Gélabert, C., Gomez-Puerto, M.C., Gallini, R., Rubin, C.J., Ten Dijke, P., Heldin, C.H., Moustakas, A.
- Source
- Full text @ Cell Death Dis.
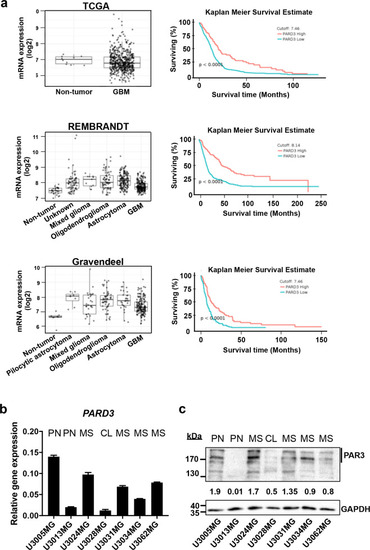
Expression of Par3 in glioblastoma.
a Expression levels of PARD3 mRNA (left panels) in GBM samples compared to non-tumoral tissue only (TCGA dataset), or to non-tumoral and other brain malignancy tissues (REMBRANDT, Gravendeel datasets). Kaplan Meier survival curves of GBM patients with low (blue curves) and high (red curves) levels of PARD3 mRNA expression according to the three datasets (TCGA, REMBRANDT, and Gravendeel) obtained using the GlioVis data portal. Statistical significance of the difference between the two curves is also indicated. b PARD3 mRNA expression relative to GAPDH mRNA in patient-derived GBM cultures (PN proneural; CL classical; MS mesenchymal subtype); results are expressed as mean ± SEM (n = 2, technical triplicate). c Par3 protein expression level in the same panel of cultures; GAPDH is used as a total protein loading control with densitometric values of Par3 relative to GAPDH listed and molecular size markers in kDa shown. |

Reduction in Par3 depletes gliomasphere formation.
U3028MG, U3031MG, and U3034MG cells were transfected with control and Par3 siRNA. a ELDA expressing median values from transfected cells (siControl, black curves; siPar3, red curves). High x-axis intercept corresponds to low number of gliomaspheres; note the large degree of shift of the median curves to the right upon Par3 silencing. The table shows the stem cell frequency (1 stem cell/x cells). For U3028MG and U3034MG: n = 2 with seven replicates, and for U3031MG: n = 4 with seven replicates. b Percentage of Ki67-positive cells in U3028MG, U3031MG and U3034MG cultures. Average measurements of n = 2 (U3028MG), n = 3 (U3031MG), n = 5 (U3034MG) independent experiments, 10−15 pictures analyzed per experiment, and associated SEM are plotted (siControl, black bars; siPar3 green bars). Statistical comparison (one-way Anova) indicates significant differences, **p < 0.01, ***p < 0.001. c, d Expression of the indicated genes in cells cultured in N2B27 plus EGF/FGF2 (N2B27 + EF, stem cell medium) or DMEM/10% FBS after 5 days of treatment; results are mean ± S.E.M. of two independent experiments with technical triplicates. Statistical comparison (one-way Anova); significant differences, *p < 0.05, ***p < 0.001. |
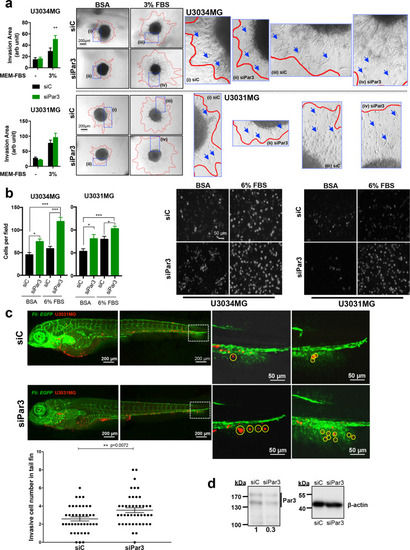
Reduction in Par3 enhances cell migration and invasion.
a Spheroids of U3031MG and U3034MG transfected with control (siC, black bars) or Par3 (green bars) siRNA embedded in collagen, invaded the matrix in the presence of MEM containing BSA (-) or MEM containing 3% FBS, and assayed after 48 h. Quantification (left) expresses results as mean ± SEM out of multiple independent experiments (for U3031MG, n = 2 with five biological replicates; for U3034MG, n = 4 with 3 biological replicates), and statistical comparison (t-test) indicates significant differences, *p < 0.05, **p < 0.01. Representative photomicrographs with red lines demarcating the outer rim formed by invasive cells (right); blue rectangles indicate magnified areas of the invasive rim with arrows pointing to invading cells. b Transwell-based invasion assays of U3031MG and U3034MG cells transfected with control (siC, black bars) or Par3 (green bars) siRNA, migrating through laminin towards DMEM/BSA or DMEM/6% FBS. Left, quantification of the number of cells per field (for U3034MG, n = 2 and for U3031MG, n = 3, in duplicate each time; for each independent experiment 15 different fields were quantified). Right, representative photomicrographs of stained nuclei of invasive cells (magnification bar, 50 µm). Results are expressed as mean ± SEM and statistical comparison (t-test) indicates significant differences, *p < 0.05, ***p < 0.001. c Invasive capacity of CM-Dil-labeled U3031MG cells after silencing Par3 was assessed in vivo after injecting approximately 400 cells in the transgenic Fli:EGFP zebrafish embryos with endothelial-specific EGFP expression. Extravasation and collagenous tail fin invasion were observed. One representative image of the whole zebrafish from each group is shown in the left panel, with two zoom-in images of the invasive cells in the tail fins of two different zebrafish from each group shown on the right panel. Invasive cells are indicated with yellow circles in the zoom-in images. Quantification of invading U3031MG numbers per fish, n = 40, presented as MEM ± S.E.M (left). Statistical comparison (t-test); significant differences, **p < 0.01. d Immunoblot demonstrating Par3 silencing efficiency in U3031MG cells injected in the zebrafish embryos. β-Actin serves as loading control, densitometric values of Par3 expression relative to β-actin are listed and molecular size markers in kDa are shown. |
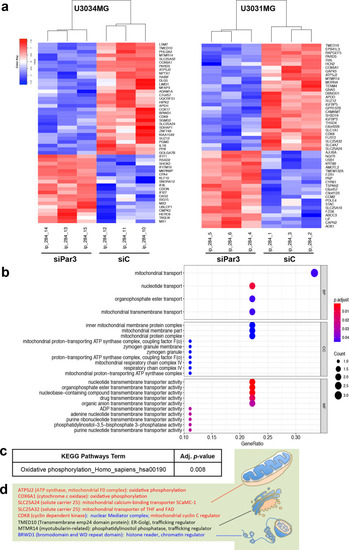
Transcriptomic analysis of U3031MG and U3034MG cells.
a Heatmap of the top-50 regulated genes (adjusted p-value < 0.05) after Par3 silencing (siPar3 vs siC) in U3034MG and U3031MG cultures. Fold-change in expression is color-coded (high, red; low, blue) in triplicate samples per biological condition. b Gene Ontology enrichment for Biological Process (BP) of the common down-regulated genes after Par3 silencing. The adjusted p-value is color-coded and the number of genes per category is shown by circle diameter. c KEGG pathway analysis for downregulated genes after Par3 silencing with the corresponding adjusted p-value. d A list of common downregulated genes after Par3 silencing along with their known functions represented schematically (mitochondria, endoplasmic reticulum-Golgi apparatus, and chromatin). |
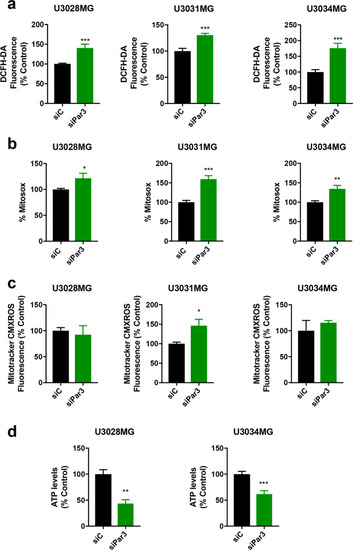
Par3 regulates ROS and mitochondrial function in GBM cells.
U3028MG, U3031MG, and U3034MG cultures were transfected with control (siC, black bars) and Par3 (green bars) siRNAs. a Intracellular ROS content measured by DCFH-DA fluorescence is expressed as percent of the control siRNA (siC) on each day. For U3028MG, n = 2 in four duplicates for day 1, n = 2 in two duplicates for day 3; for U3031MG, n = 2 in four duplicates for days 1 and 3; for U3034MG, n = 3 in four duplicates for day 1, n = 2 in four duplicates for day 3. b Mitochondrial ROS measured by MitoSOX-Red is expressed as percent of the control siRNA (siC). For U3031MG and U3034MG, n = 5 in triplicate; for U3028MG, n = 3 in triplicate. c Mitochondrial transmembrane potential analysis using MitoTracker CMXROS at day 3. For U3034MG: n = 4; for U3028MG and U3031MG, n = 2. d ATP levels in U3028MG and U3034MG cells expressed as percent of the control siRNA (siC). For U3028MG, n = 2; for U3034MG, n = 4. All results are expressed as mean ± SEM of at least two repeats; statistical comparison (t-test) indicates significant differences, *p < 0.05, **p < 0.01, **p < 0.001. |
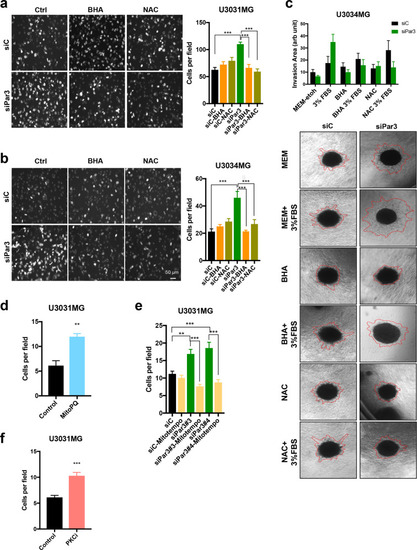
Antioxidants counteract the enhanced invasion caused by Par3 silencing.
a, b Transwell-based invasion assay of transfected U3031MG and U3034MG cells migrating through laminin towards DMEM/6% FBS in the absence (Ctrl) or presence of antioxidants BHA (200 µM) or NAC (5 mM). Representative images of invasive cells (left); magnification bar, 50 µm. Quantification of the number of cells per field (right, n = 2 in duplicate, 15 different fields per independent experiment, and results are expressed as mean ± SEM). c Spheroids embedded in collagen were treated with antioxidants BHA (200 µM) and NAC (5 mM) in the presence of MEM or MEM/3% FBS, and representative photomicrographs were recorded after 48 h. Red lines demarcate the outer rim formed by invasive cells. Quantification of the invasion area (top). Results are expressed as mean ± SEM of three replicates of n = 2 independent experiments; siControl (siC), black bars; siPar3, green bars. Transwell-based invasion assay of U3031MG cells through laminin towards DMEM/6% FBS without (Ctrl) or with 100 µM MitoPQ (d) or 1 µM aPKCi (f). The number of invading cells per field was quantified (n = 2 in duplicate, 10 different fields per independent experiment were quantified; results are expressed as mean ± SEM). e Transwell-based invasion assay of U3031MG cells transfected with control or Par3 siRNAs through laminin towards DMEM/6% FBS in the absence or presence of 50 µM MitoTEMPO; analyses were performed as above. |

Inhibiting aPKC or inducing mitochondrial ROS disrupts gliomasphere formation.
a Intracellular ROS content measured by DCFH-DA fluorescence after treatment of U3031MG cells with 1 µM aPKCi and expressed as a percent of control after 3 days. b ELDA expressing median values from U3031MG treated with 1 µM aPKCi for 10 days (Control, black curves; aPKCi treated, red curves). Note the large degree of shift of the median curves to the right upon aPKCi treatment. The table shows the stem cell frequency (1 stem cell/x cells); n = 3 with six replicates. c Intracellular ROS content measured by DCFH-DA fluorescence after treatment of U3031MG cells with 100 µM MitoPQ for 3 days and expressed as a percent of control. d ELDA expressing median values from U3031MG treated with 100 µM MitoPQ for 10 days (Control, black curves; MitoPQ treated, red curves). Note the large degree of shift of the median curves to the right upon MitoPQ treatment. The table shows the stem cell frequency (1 stem cell/x cells); n = 3 with six replicates. e Par3 localization in proximity to mitochondrial networks revealed by in situ PLA. MitoTracker Deep Red staining of mitochondria is represented in green, Par3 molecules are represented as single red dots and nuclei are visible in blue. Insets (dotted rectangles) magnify a single cell for a better visual effect. Arrows indicate co-localization. Magnification bars, 10 µm. |
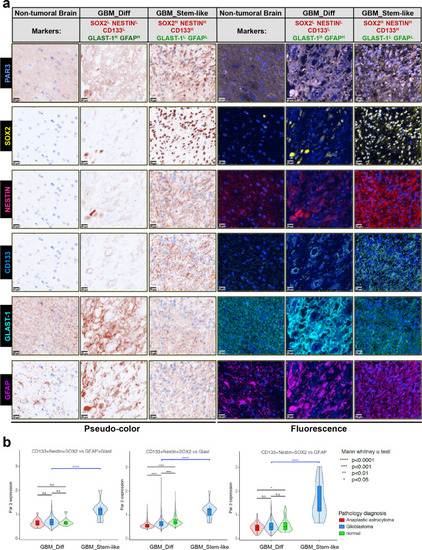
Enriched Par3-positive cells in GBM tumor tissue with stem-like cell populations.
a Representative images displaying staining of Par3, NESTIN, CD133, SOX2, GFAP, and GLAST-1, in normal brain and GBM samples. Brown pseudo-color is shown on the left and original fluorescence color to the right. Magnification bars, 100 µm. b Par3 expression in normal, GBM, and anaplastic astrocytoma samples (color-coded) plotted in relation to the five marker proteins in the same tissue. Tumor cells were divided in two groups, GBM_Diff (SOX2low/NESTINlow/CD133low/GLAST-1high/GFAPhigh), shown in the figure as SOX2L/NESTINL/CD133L/GLAST-1H/GFAPH and GBM_Stem-Like (SOX2high/NESTINhigh/CD133high/GLAST-1low/GFAPlow) shown in the figure as SOX2H/NESTINH/CD133H/GLAST-1L/GFAPL. Significant differences, *p < 0.05; ****p < 0.0001; n.s. not-significant. |