
|
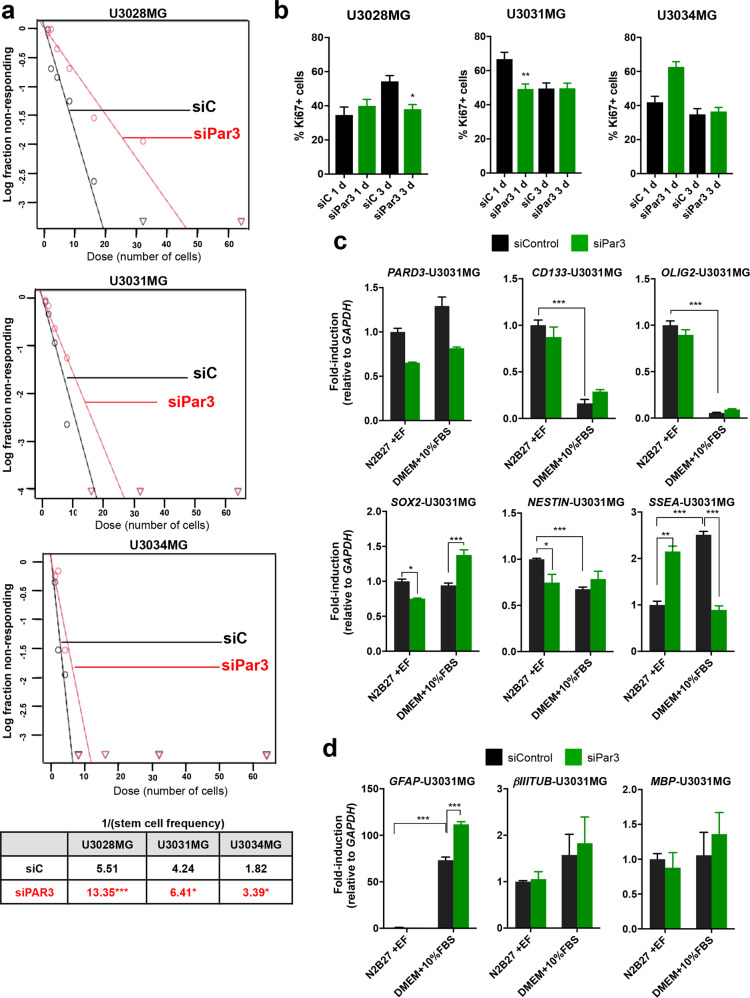
Fig. 2
U3028MG, U3031MG, and U3034MG cells were transfected with control and Par3 siRNA. a ELDA expressing median values from transfected cells (siControl, black curves; siPar3, red curves). High x-axis intercept corresponds to low number of gliomaspheres; note the large degree of shift of the median curves to the right upon Par3 silencing. The table shows the stem cell frequency (1 stem cell/x cells). For U3028MG and U3034MG: n = 2 with seven replicates, and for U3031MG: n = 4 with seven replicates. b Percentage of Ki67-positive cells in U3028MG, U3031MG and U3034MG cultures. Average measurements of n = 2 (U3028MG), n = 3 (U3031MG), n = 5 (U3034MG) independent experiments, 10−15 pictures analyzed per experiment, and associated SEM are plotted (siControl, black bars; siPar3 green bars). Statistical comparison (one-way Anova) indicates significant differences, **p < 0.01, ***p < 0.001. c, d Expression of the indicated genes in cells cultured in N2B27 plus EGF/FGF2 (N2B27 + EF, stem cell medium) or DMEM/10% FBS after 5 days of treatment; results are mean ± S.E.M. of two independent experiments with technical triplicates. Statistical comparison (one-way Anova); significant differences, *p < 0.05, ***p < 0.001.