
|
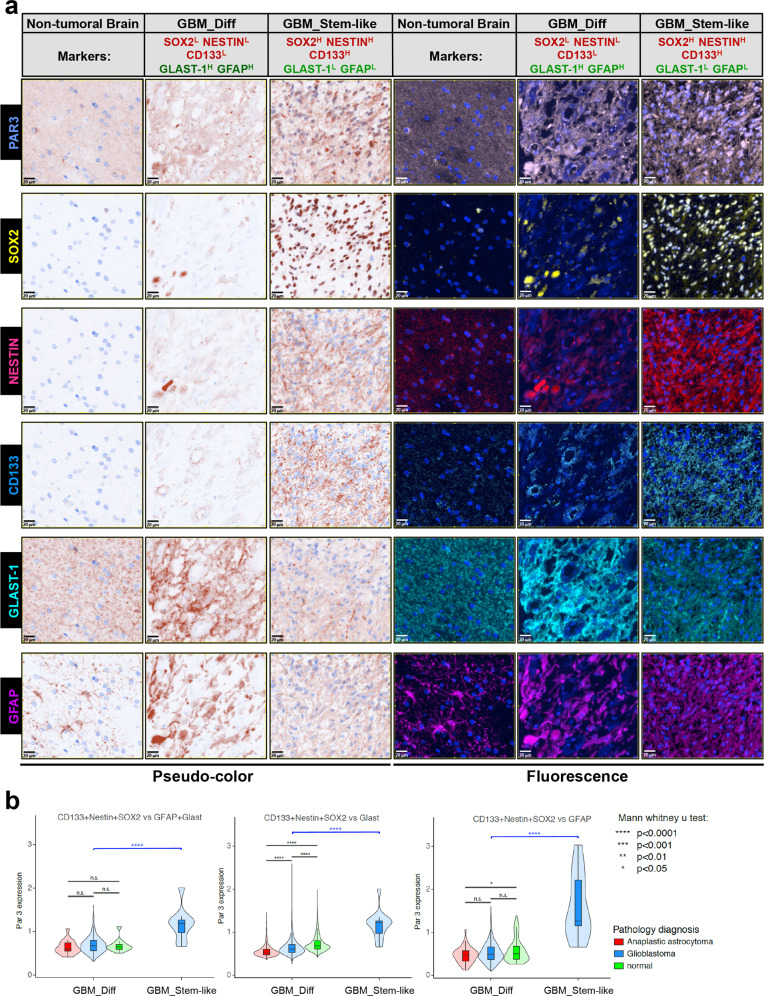
Fig. 8
a Representative images displaying staining of Par3, NESTIN, CD133, SOX2, GFAP, and GLAST-1, in normal brain and GBM samples. Brown pseudo-color is shown on the left and original fluorescence color to the right. Magnification bars, 100 µm. b Par3 expression in normal, GBM, and anaplastic astrocytoma samples (color-coded) plotted in relation to the five marker proteins in the same tissue. Tumor cells were divided in two groups, GBM_Diff (SOX2low/NESTINlow/CD133low/GLAST-1high/GFAPhigh), shown in the figure as SOX2L/NESTINL/CD133L/GLAST-1H/GFAPH and GBM_Stem-Like (SOX2high/NESTINhigh/CD133high/GLAST-1low/GFAPlow) shown in the figure as SOX2H/NESTINH/CD133H/GLAST-1L/GFAPL. Significant differences, *p < 0.05; ****p < 0.0001; n.s. not-significant.