
|
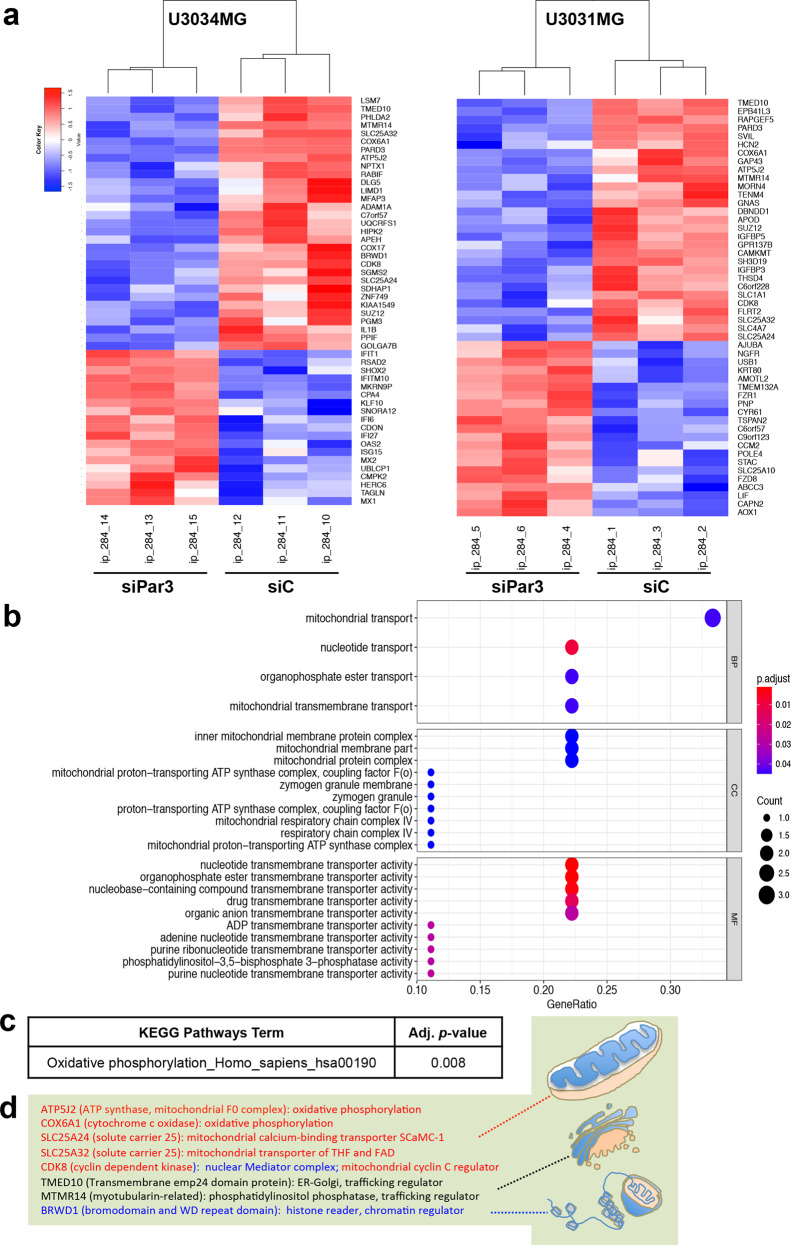
Fig. 4
a Heatmap of the top-50 regulated genes (adjusted p-value < 0.05) after Par3 silencing (siPar3 vs siC) in U3034MG and U3031MG cultures. Fold-change in expression is color-coded (high, red; low, blue) in triplicate samples per biological condition. b Gene Ontology enrichment for Biological Process (BP) of the common down-regulated genes after Par3 silencing. The adjusted p-value is color-coded and the number of genes per category is shown by circle diameter. c KEGG pathway analysis for downregulated genes after Par3 silencing with the corresponding adjusted p-value. d A list of common downregulated genes after Par3 silencing along with their known functions represented schematically (mitochondria, endoplasmic reticulum-Golgi apparatus, and chromatin).