
|
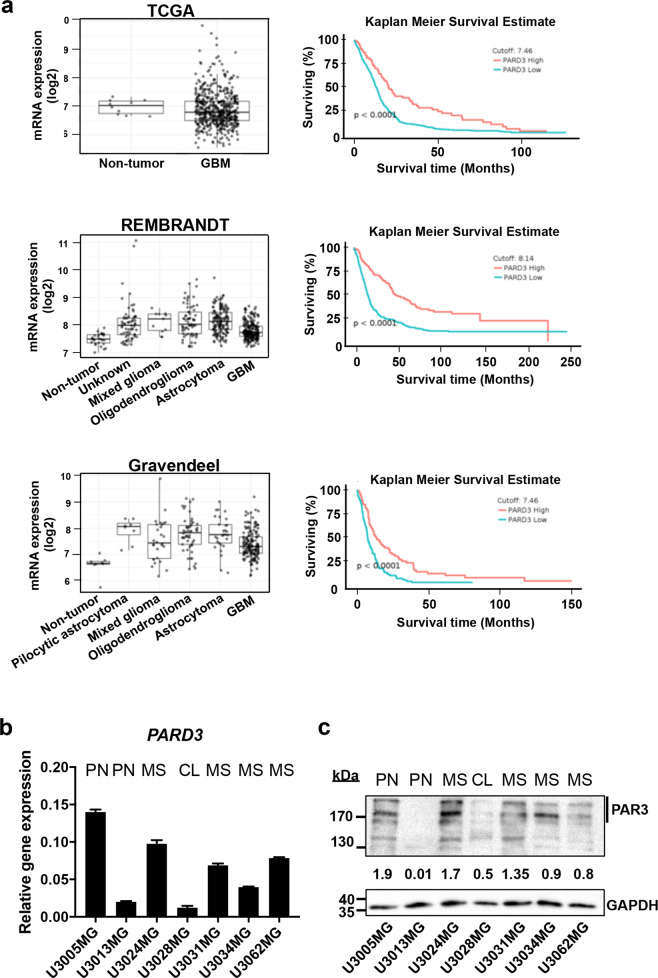
Fig. 1
a Expression levels of PARD3 mRNA (left panels) in GBM samples compared to non-tumoral tissue only (TCGA dataset), or to non-tumoral and other brain malignancy tissues (REMBRANDT, Gravendeel datasets). Kaplan Meier survival curves of GBM patients with low (blue curves) and high (red curves) levels of PARD3 mRNA expression according to the three datasets (TCGA, REMBRANDT, and Gravendeel) obtained using the GlioVis data portal. Statistical significance of the difference between the two curves is also indicated. b PARD3 mRNA expression relative to GAPDH mRNA in patient-derived GBM cultures (PN proneural; CL classical; MS mesenchymal subtype); results are expressed as mean ± SEM (n = 2, technical triplicate). c Par3 protein expression level in the same panel of cultures; GAPDH is used as a total protein loading control with densitometric values of Par3 relative to GAPDH listed and molecular size markers in kDa shown.