
- Title
-
The Adaptor Protein Lurap1 Is Required for Cell Cohesion during Epiboly Movement in Zebrafish
- Authors
- Li, J.T., Cheng, X.N., Zhang, C., Shi, D.L., Shao, M.
- Source
- Full text @ Biology (Basel)
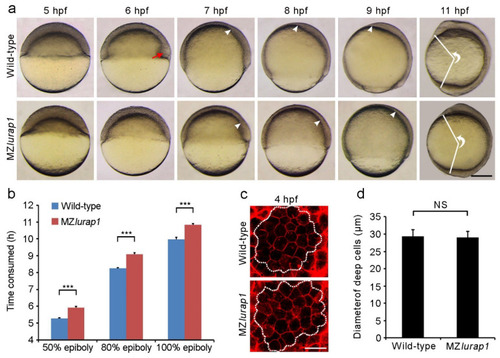
Delayed epiboly movement and reduced anteroposterior axis elongation in MZlurap1 mutant embryos. (a) Live images show epiboly progression in time-matched wild-type and MZlurap1 mutant embryos. Lateral view with animal pole or anterior region on the top. The red arrow indicates the embryonic shield; white arrowheads indicate the front of collective migration of prechordal mesendoderm. The extent of anteroposterior axis elongation is reflected by the angle formed between the most anterior end and the most posterior end, with vertex at the geometric centre of the embryo. Scale bar: 200 µm. (b) Comparison of the time interval to reach indicated epiboly stages between wild-type and MZlurap1 mutant embryos. Data were collected from three independent crosses, using a total of 150 embryos for each group. Bars represent the mean value ± s.d. (***, p < 0.001). (c) Examination of deep cell size at the animal pole region (dashed circles) in wild-type and MZlurap1 mutant embryos at 4 hpf. Scale bar: 50 µm. (d) Measurement of cell diameters by assuming that all cells are spherical. For each condition, data were obtained using 10 embryos from three independent crosses. Bars represent the mean value ± s.d. (NS, not significant). |
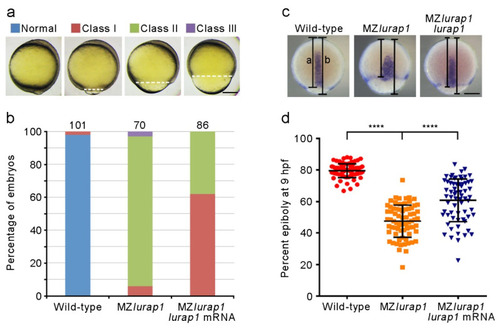
Rescue of epiboly delay in MZlurap1 mutant embryos by Lurap1. (a) Classification of the severity of epiboly delay at 10 hpf: normal embryos complete epiboly; class I embryos reach 90% epiboly; class II embryos show 75% to 90% epiboly; class III embryos fail to accomplish 75% epiboly. Broken lines indicate the leading edge of the blastoderm margin. Scale bar: 200 µm. (b) Graph shows the proportion of embryos with different degrees of epiboly delay. Numbers on the top of each stacked column represent total embryos scored from three independent experiments, and color keys are as indicated in (a). The results were analyzed independently in a blended manner. (c) Determination of the rescue efficiency by in situ hybridization analysis of tbxta to visualize the leading edge of the blastoderm margin at 9 hpf. Epiboly progression was calculated as the distance from the animal pole to the edge of the blastoderm margin (a) relative to the length of the animal-vegetal axis (b). Scale bar: 200 µm. (d) Scatter plot shows the rescue of epiboly progression in MZlurap1 mutant embryos by wild-type lurap1 mRNA. Data are mean ± s.d. from three independent batches of embryos (****, p < 0.0001). |

Delayed epibloy progression and reduced spreading capacity of DEL cells in MZlurap1 mutant embryos. (a) Phalloidin and DAPI staining of wild-type and MZlurap1 mutant embryos at 80% epiboly. Scale bar: 100 μm. (b) Statistical analysis of the extent of vegetal movements of the EVL and the DEL in wild-type and MZlurap1 mutant embryos. The percentage of epiboly was determined as the distance from the animal pole to the front of the EVL or the DEL margin with respect to the distance between the animal pole and the vegetal pole. Data were collected from 8 to 9 wild-type or MZlurap1 mutant embryos. Bar represents the mean value ± s.d. (NS, not significant; *, p < 0.05). (c) UV-induced green to red fluorescence conversion of Kaede GFP in the animal pole region at 4 hpf. Areas within dashed circles reflect the extent of DEL cell spreading at indicated times. Scale bar: 100 μm. (d) Statistical analysis of the extent of cell spreading. Data were collected from 6 embryos for each condition in three independent experiments, and the area initially occupied by labeled cells in wild-type embryos is normalized as 1. Bars represent the mean value ± s.d. (NS, not significant; *, p < 0.05; ***, p < 0.001). (e) Representative images of mGFP-labeled wild-type cells or MZlurap1 mutant cells transplanted to unlabeled wild-type recipients. Scale bar: 10 µm. |
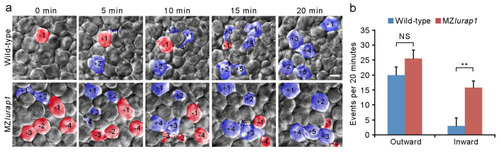
Defective radial intercalation of DEL cells in MZlurap1 mutant embryos. (a) Still frames from representative time-lapse imaging of DEL cell movements in the animal pole region of wild-type and MZlurap1 mutant embryos at 50% epiboly. The focal plane was set at the outermost layer of the DEL immediately underlying the EVL. Cells undergoing outward movements are fake color labeled blue, and are attributed with positive numbers, while cells undergoing inward movements are labeled red, and are attributed with negative numbers. Scale bar: 10 μm. (b) Statistical analysis compares inward and outward movements in the same focal plane during a period of 20 min. The results were analyzed independently in a blended manner. Data were collected from 5 embryos for each group in three independent experiments. Bars represent the mean value ± s.d. (NS, not significant; **, p < 0.01). |
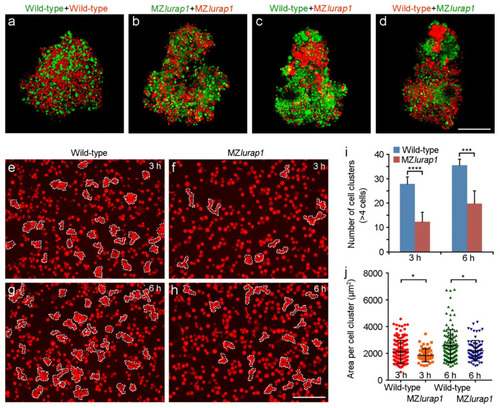
Reduced blastoderm cell cohesion in MZlurap1 mutant embryos. (a–d) Representative images from hang drop assay show differential affinity between wild-type and MZlurap1 mutant cells, as reflected by the preferential aggregation of cells with the same genotypes. Scale bar: 200 µm. (e–h) Representative images show cluster formation in wild-type and MZlurap1 mutant cells on fibronectin-coated substrates. At 3 h and 6 h, clusters consisted of at least 4 cells in close contact are encircled by dashed lines. Scale bar: 200 µm. (i,j) Statistical analyses compare the number and the size of cell clusters formed by wild-type and MZlurap1 mutant cells at 3 h and 6 h. Data were collected from 6 randomly selected view fields for each condition. Bars represent the mean value ± s.d. (*, i>p < 0.05; ***, p < 0.001; ****, p < 0.0001). |
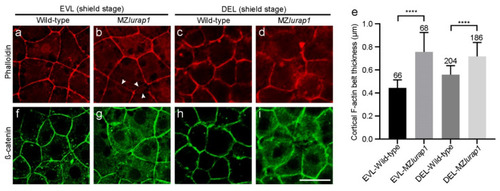
Disrupted cortical F-actin organization in the blastoderm of MZlurap1 mutant embryos. (a) Thin cortical F-actin belt is tightly organized in EVL cells of wild-type embryos. (b) Slightly diffuse and disrupted (arrows) cortical F-actin belt in EVL cells of MZlurap1 mutant embryos. (c) Loosely organized cortical F-actin in DEL cells of wild-type embryos. (d) Strongly diffuse and disrupted cortical F-actin in DEL cells of MZlurap1 mutant embryos. (e) Statistical analyses of cortical F-actin belt thickness. Data were obtained using 3 embryos from independent experiments in each condition. Numbers on the top of each column represent total cells examined in at least 3 embryos from different experiments. Bars represent the mean value ± s.d. (****, p < 0.0001). (f) Regular localization of cortical ß-catenin in EVL cells of wild-type embryos. (g) Disrupted and relatively diffuse localization of cortical ß-catenin in EVL cells of MZlurap1 mutant embryos. (h) ß-catenin localization in DEL cells of wild-type embryos. (i) Strongly disrupted ß-catenin and diffuse localization in DEL cells of MZlurap1 mutant embryos. Scale bar: 20 µm. |