
|
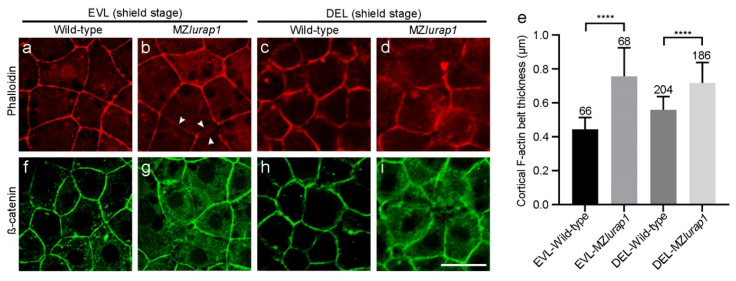
Figure 6 Disrupted cortical F-actin organization in the blastoderm of MZlurap1 mutant embryos. (a) Thin cortical F-actin belt is tightly organized in EVL cells of wild-type embryos. (b) Slightly diffuse and disrupted (arrows) cortical F-actin belt in EVL cells of MZlurap1 mutant embryos. (c) Loosely organized cortical F-actin in DEL cells of wild-type embryos. (d) Strongly diffuse and disrupted cortical F-actin in DEL cells of MZlurap1 mutant embryos. (e) Statistical analyses of cortical F-actin belt thickness. Data were obtained using 3 embryos from independent experiments in each condition. Numbers on the top of each column represent total cells examined in at least 3 embryos from different experiments. Bars represent the mean value ± s.d. (****, p < 0.0001). (f) Regular localization of cortical ß-catenin in EVL cells of wild-type embryos. (g) Disrupted and relatively diffuse localization of cortical ß-catenin in EVL cells of MZlurap1 mutant embryos. (h) ß-catenin localization in DEL cells of wild-type embryos. (i) Strongly disrupted ß-catenin and diffuse localization in DEL cells of MZlurap1 mutant embryos. Scale bar: 20 µm.