
|
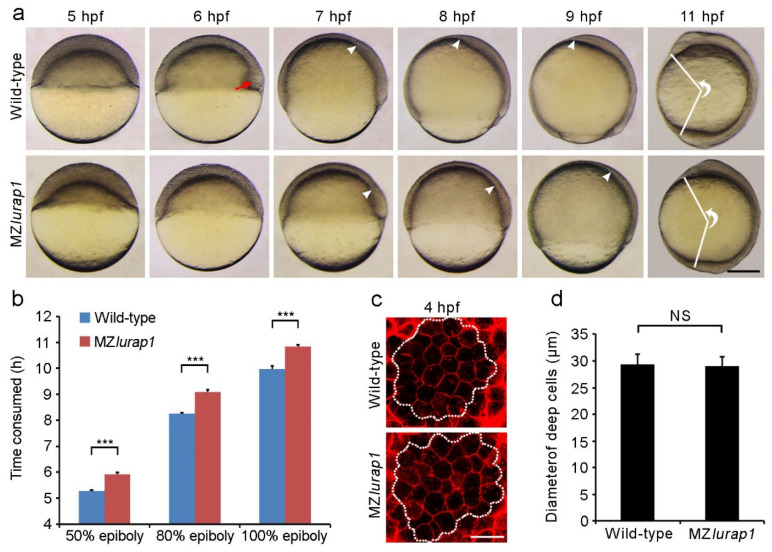
Figure 1 Delayed epiboly movement and reduced anteroposterior axis elongation in MZlurap1 mutant embryos. (a) Live images show epiboly progression in time-matched wild-type and MZlurap1 mutant embryos. Lateral view with animal pole or anterior region on the top. The red arrow indicates the embryonic shield; white arrowheads indicate the front of collective migration of prechordal mesendoderm. The extent of anteroposterior axis elongation is reflected by the angle formed between the most anterior end and the most posterior end, with vertex at the geometric centre of the embryo. Scale bar: 200 µm. (b) Comparison of the time interval to reach indicated epiboly stages between wild-type and MZlurap1 mutant embryos. Data were collected from three independent crosses, using a total of 150 embryos for each group. Bars represent the mean value ± s.d. (***, p < 0.001). (c) Examination of deep cell size at the animal pole region (dashed circles) in wild-type and MZlurap1 mutant embryos at 4 hpf. Scale bar: 50 µm. (d) Measurement of cell diameters by assuming that all cells are spherical. For each condition, data were obtained using 10 embryos from three independent crosses. Bars represent the mean value ± s.d. (NS, not significant).