
- Title
-
Efficacy of epetraborole against Mycobacterium abscessus is increased with norvaline
- Authors
- Sullivan, J.R., Lupien, A., Kalthoff, E., Hamela, C., Taylor, L., Munro, K.A., Schmeing, T.M., Kremer, L., Behr, M.A.
- Source
- Full text @ PLoS Pathog.

A Structure of EPT. B Epetraborole kill kinetics of M. abscessus in vitro. Bacteria were incubated in 7H9 complete with drug-free (black circles), AMK 20X MIC90 (blue squares, 80 ?g/mL), RIF 20X MIC90 (red triangles, 60 ?g/mL), EPT 20X MIC90 (yellow hexagons, 1.6 ?g/mL), EPT 40X MIC90 (orange diamonds, 3.2 ?g/mL), or EPT 80X MIC90 (brown inverted triangles, 6.4 ?g/mL). The dashed red line indicates 99.9% or 3 log10 reduction in CFU/mL threshold of a bactericidal drug. Data shown is mean � SD of three independent experiments. C MIC90 from induced cultures relative to drug free conditions. Bacteria were grown to OD600 0.05 and induced with no drug (white), 0.016 ?g/mL CLR (yellow), 0.016 ?g/mL EPT (blue). After 24 hours (left) or 14 days (right) of induction, cultures were passaged for 6 days in drug free media (dotted bars). Data shown is mean � SD from three independent experiments. Error bars for drug free data derived from MIC90 / MIC90 average from three or six replicates. *, p = 0.02; **, p = 0.0017; ****, p = 0.0005 by one-way ANOVA with Tukey?s multiple comparisons test. |

A EPT toxicity against zebrafish embryos. Groups of uninfected embryos were immersed in water containing 10 to 50?g/mL EPT for 5 days. Red bar indicates duration of treatment. Data is from two independent experiments. B EPT in vivo activity in zebrafish embryos. Zebrafish embryos at 30 h postfertilization were infected with approximately 200 CFUs of M. abscessus expressing green fluorescent wasabi or PBS via caudal vein injection. At 1 dpi, embryos were randomly split into approximately 20 embryos per group and exposed to increasing concentrations of EPT (10 and 40 ?g/mL) in fish water. Drugs were renewed at a daily basis for 5 days (red bar) after which embryos were washed twice in fresh embryo water and maintained in fish water. Each treatment group was compared against the untreated infected group with significant differences calculated using the log-rank (Mantel-Cox) statistical test for survival curves. Data shown are the merge of four independent experiments. *, p = 0.02; ***, p = 0.0007. C Fluorescent Pixel Counts (FPC) determination using the ImageJ software, reflecting the bacterial loads at 4 and 6 days post-infection (dpi). Each bar represents a pool of the average of normalized FPC from three independent experiments (n = 22 to 36 embryos). Error bars represent standard deviations. Statistical significance was determined using Welch?s t test. **, p ? 0.0054. D Representative whole embryos from the untreated group (upper panels) and treated group (10 or 40 ?g/mL EPT; lower panels) at 4 and 6 dpi. Green overlay represents M. abscessus expressing wasabi. Scale bar, 200 ?m. |
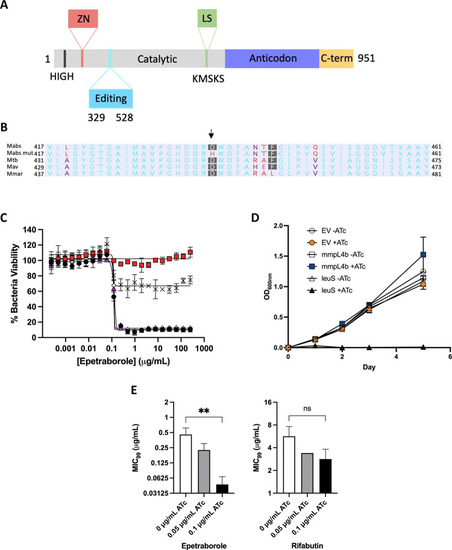
A Domains of M. abscessus LeuRS. Zinc domain, pink; editing domain, cyan; catalytic domain, grey; leucine-rich domain, green; anticodon-binding domain, purple; c-terminus, yellow. B Amino acid alignment of part of the editing domain of LeuRS M. abscessus ATCC 19977, EPT mutant, and reference mycobacteria. Non-consensus residues are in red. Genbank accession numbers: P9WFV1.1 (M. tuberculosis) 11896261 (M. avium) 6224275 (M. marinum). C Dose-response curves of M. abscessus ATCC 19977 (black circles), D436H mutant (red squares), M. abscessus empty vector (white diamonds), M. abscessus pMVhsp60_leuS (pink triangles) and M. abscessus pMV306hsp60_leuSD436H (crosses). Data shown is mean � SD from one experiment representative of two. D leuS is an essential gene in M. abscessus using CRISPRi gene knockdown. M. abscessus carrying integrated empty CRISPRi vector (EV, circles), CRISPRi:mmpL4b as a non-essential gene control (squares), or CRISPRi:leuS (triangles) were grown with/without 0.01 ?g/mL ATc. Data is mean � SD from biological triplicates. E MIC99 to EPT and RFB in CRISPRi knockdown of leuS in M. abscessus. **, p = 0.005; ns, no statistical significance by one-way ANOVA with Dunnett?s multiple comparisons test. Data shown is mean � SD from three biological replicates. |
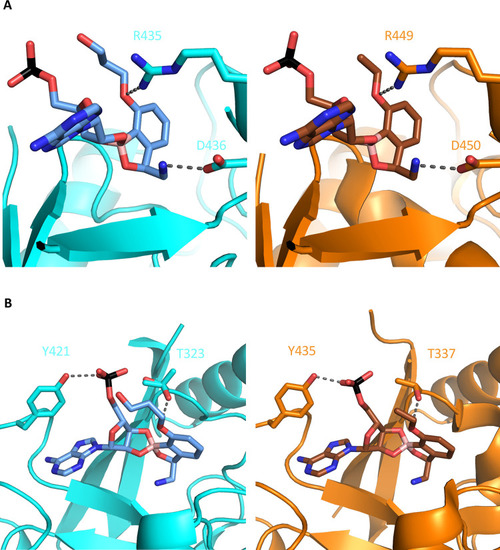
EPT-AMP (blue) bound in the active site of M. abscessus LeuRS (cyan) and a similar benzoxaborole-AMP (brown) bound in active site of M. tuberculosis LeuRS (PDB 5AGR) (orange). A Critical arginine and aspartic acid residues make similar interactions with benzoxaboroles. B Phosphate from AMP pivots towards threonine residue in M. abscessus LeuRS. Conformer 1 of T323 points OH towards EPT, while conformer 2 orients OH towards the phosphate. |

A ATCC 19977, D436H mutant, and D436H:leuSD complement strains were grown in Sauton media with 59 ?g/mL norvaline (top left), 66 ?g/mL leucine (top right), 59 ?g/mL valine (lower left), or 66 ?g/mL isoleucine (lower right). Data shown is from three biological replicates, one-way ANOVA with Tukey?s multiple comparisons test. ****, p < 0.0001. B D436H mutant grown in Sauton media with 59 ?g/mL norvaline and a range of leucine (left), isoleucine (middle), or valine (right). D436H mutant grown in 0 ?g/mL norvaline and 0 ?g/mL BCAA represents growth control. D436H mutant grown in 59 ?g/mL norvaline and 0 ?g/mL BCAA represents inhibited growth control. BCAAs added to cultures from 33 ?g/mL to 262 ?g/mL (Leu/Ile) or 29 ?g/mL to 234 ?g/mL (Val). Data shown is mean � SD from three biological replicates. Groups compared to inhibited growth control with one-way ANOVA with Dunnett?s multiple comparisons test. ***, p = 0.0009; ****, p ? 0.0001. |
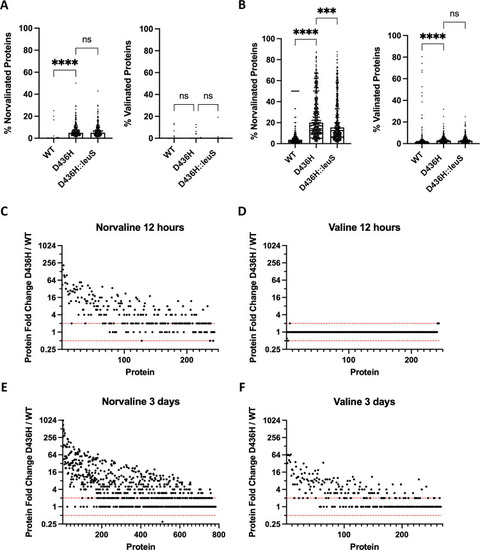
A-B M. abscessus ATCC 19977 or D436H mutant was grown in 59 ?g/mL valine or 59 ?g/mL norvaline for 12 hours or 3 days. Valine was used as a specificity control. Total cell lysate was collected. (Nor)valinated protein medians from the proteomes were compared using Kruskal-Wallis with Dunn?s multiple comparisons test. ***, p = 0.0005; ****, p < 0.0001; ns, no statistical significance. C-F Protein fold abundance shown as D436H mutant relative to M. abscessus ATCC 19977. Dashed red lines indicate 0.5x and 2x fold abundance thresholds for biologically relevant changes. |

A Protein-protein interaction network from the 130 most abundant proteins in D436H mutant when challenged with 59 ?g/mL norvaline for 12 hours. 942 PPIs identified with PPI enrichment p-value < 1.0x10⁻¹⁶. B PPI network from 130 randomly selected proteins in D436H mutant when challenged with 59 ?g/mL norvaline for 12 hours. 102 PPIs identified with PPI enrichment p-value of 0.0397. C Clp protease/chaperonin family local network cluster identified in a (false discovery rate: 0.00072). D Temporal signature of the heat shock response. Protein expression levels of D436H norvaline relative to WT norvaline were measured by spectral counting. |

A Mutant frequency to 10X MIC90 EPT (0.63 ?g/mL) or 10X MIC90 EPT + 10X MIC90 norvaline (590 ?g/mL) in M. abscessus ATCC 19977 and M. tuberculosis H37Rv. Data shown is mean � SD from biological triplicates. Means compared using Poisson distribution. *, p < 0.0001; ns, no statistical significance. B M. abscessus susceptibility to EPT with norvaline as an adjuvant. Data shown is mean � SD from one experiment representative of three. C EPT in vivo activity in SCID mouse model of M. abscessus lung infection with norvaline supplementation. Rifabutin (RFB) acts as positive control. Data shown is mean � SD of three to five mice per treatment group. Means compared using one-way ANOVA with Tukey?s multiple comparisons test. **, p < 0.007; ***, p < 0.0005; ****; p < 0.0001; ns, no statistical significance. |