
|
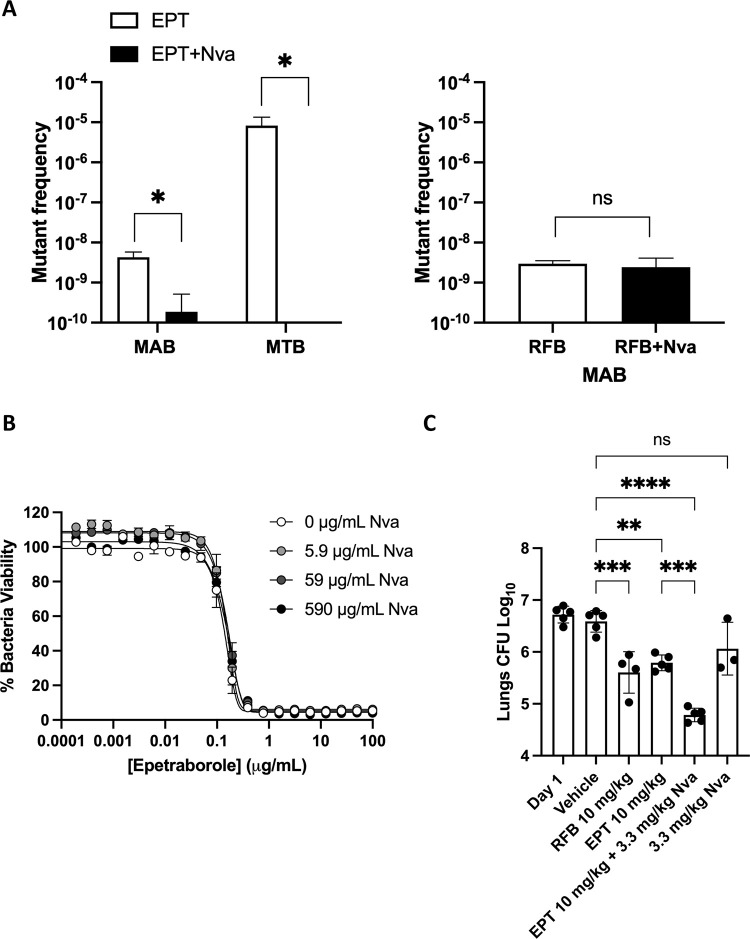
Fig 8
A Mutant frequency to 10X MIC90 EPT (0.63 μg/mL) or 10X MIC90 EPT + 10X MIC90 norvaline (590 μg/mL) in M. abscessus ATCC 19977 and M. tuberculosis H37Rv. Data shown is mean ± SD from biological triplicates. Means compared using Poisson distribution. *, p < 0.0001; ns, no statistical significance. B M. abscessus susceptibility to EPT with norvaline as an adjuvant. Data shown is mean ± SD from one experiment representative of three. C EPT in vivo activity in SCID mouse model of M. abscessus lung infection with norvaline supplementation. Rifabutin (RFB) acts as positive control. Data shown is mean ± SD of three to five mice per treatment group. Means compared using one-way ANOVA with Tukey’s multiple comparisons test. **, p < 0.007; ***, p < 0.0005; ****; p < 0.0001; ns, no statistical significance.