
|
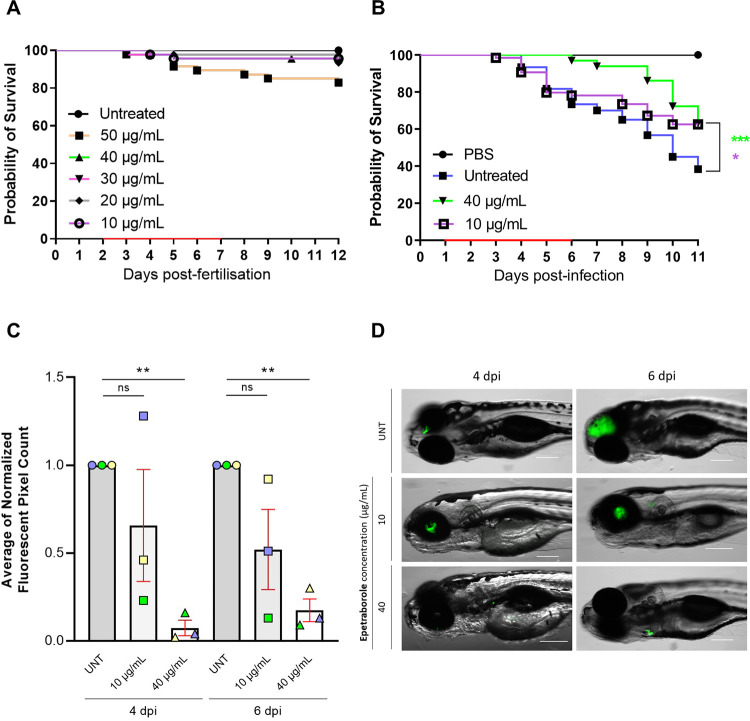
Fig 2
A EPT toxicity against zebrafish embryos. Groups of uninfected embryos were immersed in water containing 10 to 50μg/mL EPT for 5 days. Red bar indicates duration of treatment. Data is from two independent experiments. B EPT in vivo activity in zebrafish embryos. Zebrafish embryos at 30 h postfertilization were infected with approximately 200 CFUs of M. abscessus expressing green fluorescent wasabi or PBS via caudal vein injection. At 1 dpi, embryos were randomly split into approximately 20 embryos per group and exposed to increasing concentrations of EPT (10 and 40 μg/mL) in fish water. Drugs were renewed at a daily basis for 5 days (red bar) after which embryos were washed twice in fresh embryo water and maintained in fish water. Each treatment group was compared against the untreated infected group with significant differences calculated using the log-rank (Mantel-Cox) statistical test for survival curves. Data shown are the merge of four independent experiments. *, p = 0.02; ***, p = 0.0007. C Fluorescent Pixel Counts (FPC) determination using the ImageJ software, reflecting the bacterial loads at 4 and 6 days post-infection (dpi). Each bar represents a pool of the average of normalized FPC from three independent experiments (n = 22 to 36 embryos). Error bars represent standard deviations. Statistical significance was determined using Welch’s t test. **, p ≤ 0.0054. D Representative whole embryos from the untreated group (upper panels) and treated group (10 or 40 μg/mL EPT; lower panels) at 4 and 6 dpi. Green overlay represents M. abscessus expressing wasabi. Scale bar, 200 μm.