
- Title
-
Acute brain vascular regeneration occurs via lymphatic transdifferentiation
- Authors
- Chen, J., Li, X., Ni, R., Chen, Q., Yang, Q., He, J., Luo, L.
- Source
- Full text @ Dev. Cell
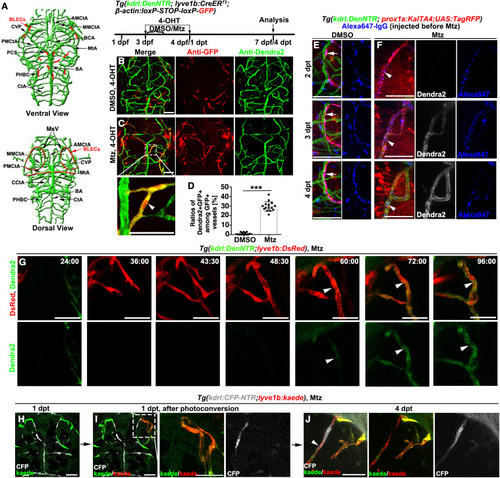
Figure 1. Early brain BV regeneration occurs via iLV-to-BV transdifferentiation (A) The ventral and dorsal views of zebrafish brain vasculature at larval stages, which include all the imaging areas of high magnification pictures. Green and red represent brain BVs and BLECs, respectively. (B–D) Uninjured larvae controls (B), a portion of GFP+ vessels were positive for Dendra2 after Mtz treatment (C), which is shown in higher magnification in the framed area (arrowhead). (D) The statistics show ratios of the Dendra2+GFP+ vessels among GFP+ vessels (n = 15 larvae; ∗∗∗, p < 0.0001). (E and F) In contrast to the RFP+Alexa647+ BLECs in the uninjured control (E, arrows), the RFP+Alexa647+ iLVs gradually expressed Dendra2 from 2 dpt to 4 dpt after Mtz treatment (F, arrowheads). The Alexa647-IgG was injected before Mtz treatment. See also Video S1. (G) Time-lapse imaging showed the real-time processes of iLV ingrowth and gain of Dendra2 fluorescence. The expression of Dendra2 became detectable from 60:00/60 hpt. Arrowheads indicate the transdifferentiating iLVs. The elapsed time is indicated in hours:minutes after 0 dpt. See also Video S2. (H–J) BLECs were labeled by Kaede green at 1 dpt shortly before ingrowth (H). The photoconverted BLECs were marked by the white frame in (I) and enlarged in the right panels. At 4 dpt, one iLV derived from the Kaede-red BLECs expressed the BEC-specific CFP (J, arrowhead). See also Video S3. Scale bar, 50 μm. See also Figures S1 and S2. AMCtA, anterior (rostral) mesencephalic central artery; PCS, posterior (caudal) communicating segment; BCA, basal communicating artery; BA, basilar artery; CCtA, cerebellar central artery; CtA, central artery; CVP, choroidal vascular plexus; MMCtA, middle mesencephalic central artery; MsV, mesencephalic vein; MtA, metencephalic artery; PHBC, primordial hindbrain channel; PMCtA, posterior (caudal) mesencephalic central artery; BLECs, brain lymphatic endothelial cells. |
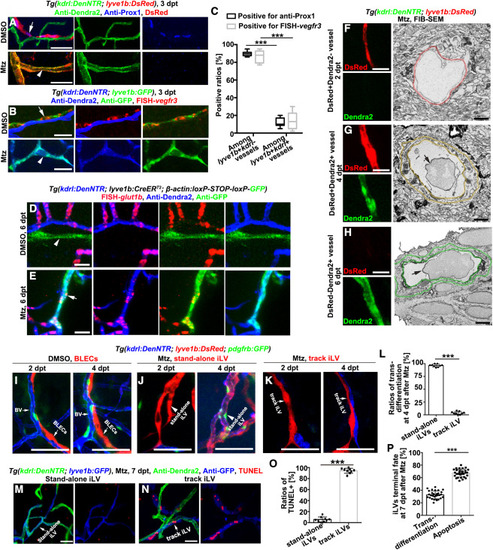
Figure 2. The transdifferentiating iLVs switch molecular and structural identities and are restricted to stand-alone iLVs (A–C) The lyve1b+kdrl− BLECs in the uninjured control (arrows), but not the transdifferentiating lyve1b+kdrl+ iLVs at 3 dpt after injury (arrowheads), were positive for anti-Prox1 (A) and fluorescence in situ hybridization (FISH)-vegfr3 (B). The statistics show the ratios of vessels positive for anti-Prox1 or FISH-vegfr3 among all the lyve1b+kdrl− vessels and all the lyve1b+kdrl+ vessels. (C) (n = 6 larvae; two-way ANOVA by Dunnett’s multiple comparisons test; ∗∗∗, p < 0.0001). Scale bar, 20 μm. (D and E) Positive control brain BVs in the uninjured larvae (D), the lineage-tracing system indicated that the vessels double positive for GFP and Dendra2 (E, arrow) and single positive for Dendra2 (D and E) expressed the blood-brain barrier marker glut1b, but vessels single positive for GFP (D, arrowhead) did not. Scale bar, 20 μm. (F–H) Single FIB-SEM image planes (right row) indicate cross sections of the vessels shown in the left row. Note that the mural of the DsRed+Dendra2+ vessel (G) is similar to the DsRed-Dendra2+ BV (H) but much thicker than the DsRed+Dendra2− iLV (F). Color rings mark the inner and outer surfaces of murals. Arrows indicate blood cells. Scale bars, 20 and 1 μm. (I–L) Live imaging shows BLECs (I), stand-alone iLVs (J, arrows), and track iLVs (K) at 2 and 4 dpt. Note that only the stand-alone iLVs express Dendra2 and recruit the GFP+ pericytes at 4 dpt (J, arrowheads). (L) The statistics show the ratios of transdifferentiation in the stand-alone iLVs and track iLVs at 4 dpt (n = 9 larvae; two-tailed unpaired t test; ∗∗∗, p < 0.0001). Scale bar, 50 μm. (M–P) The TUNEL signals in the stand-alone iLVs (M) and track iLVs (N) at 7 dpt. The statistics show the ratios of TUNEL+ cells in stand-alone iLVs and in track iLVs (O) (n = 9 larvae; ∗∗∗, p < 0.0001), and the ratios of iLVs undergoing transdifferentiation (Dendra2+GFP+) or undergoing apoptosis (GFP+TUNEL+) among all the iLVs at 7 dpt (P) (n = 30 larvae; two-tailed unpaired t test; ∗∗∗, p < 0.0001). Scale bar, 50 μm. Data are represented as mean ± SD. See also Figure S2. |
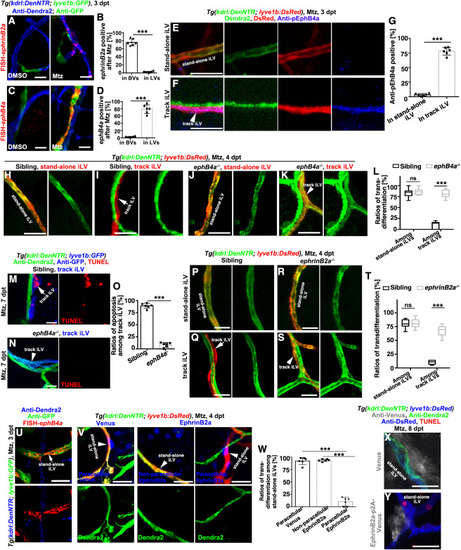
Figure 3. EphrinB2a/EphB4a are necessary and sufficient to inhibit the iLV-to-BV transdifferentiation (A–D) In contrast to their absence in the brain of uninjured control, ephrinB2a and ephB4a were, respectively, activated in the Dendra2+GFP− BVs and Dendra2−GFP+LVs after Mtz treatment (A and C). The statistics show ephrinB2a and ephB4a expression in the vessels, respectively (B and D) (n = 6 larvae; two-tailed unpaired t test; ∗∗∗, p < 0.0001). (E–G) In contrast to the stand-alone iLV (E), expression of the tyrosine-phosphorylated EphB4 (pEphB4) indicate the activation of EphB4a in the track iLVs of the injured brain (F). The statistics show the ratios of pEphB4-positive among stand-alone and track iLVs (G) (n = 6 larvae; two-tailed unpaired t test; ∗∗∗, p < 0.0001). (H–L) After Mtz treatment, the stand-alone iLV (H) underwent transdifferentiation in siblings, but the track iLVs (I, arrow) did not. In the ephB4a mutant, both stand-alone (J) and track iLVs expressed Dendra2 (K, arrowhead). The statistics show the ratios of transdifferentiation among stand-alone iLVs and track iLVs in siblings and in the ephB4a mutant (L) (n = 7 larvae; two-way ANOVA by Sidak’s multiple comparisons test; ns, p = 0.7299; ∗∗∗, p < 0.0001). See also Video S6. (M–O) After Mtz treatment, the track iLVs finally underwent apoptosis (M, arrow). In the ephB4a mutant, the track iLVs expressed Dendra2 and became TUNEL-negative (N, arrowhead). The statistics show the ratios of apoptosis among the track iLVs in sibling and in the ephb4a mutant (O) (n = 6 larvae; two-tailed unpaired t test; ∗∗∗, p < 0.0001). (P–T) In contrast to siblings (Q, arrow), the track iLVs in the ephrinB2a mutant expressed Dendra2 (S, arrowhead), whereas the transdifferentiation of stand-alone iLVs remained unaffected (P and R). The statistics show the ratios of transdifferentiation among stand-alone iLVs and track iLVs in sibling and in the ephrinB2a mutant (T) (n = 7 larvae; two-way ANOVA by Sidak’s multiple comparisons test; ns, p = 0.9675; ∗∗∗, p < 0.0001). (U–W) The ephB4a expressed in the stand-alone iLVs after Mtz treatment (U). The paracellularly expressed EphrinB2a, repressed the Dendra2 expression in the stand-alone iLVs (V), but the nonparacellular EphrinB2a or paracellular Venus did not. The statistics show the ratios of transdifferentiation in the subpopulations of stand-alone iLVs (W) (n = 6 larvae; two-tailed unpaired t test; ∗∗∗, p < 0.0001). (X and Y) The paracellularly expressed EphrinB2a (Y) caused apoptosis of the stand-alone iLVs, but Venus (X) did not. Scale bar, 20 μm. NS, not significant. Data are represented as mean ± SD. See also Figures S3, S4, S5, and S7. |
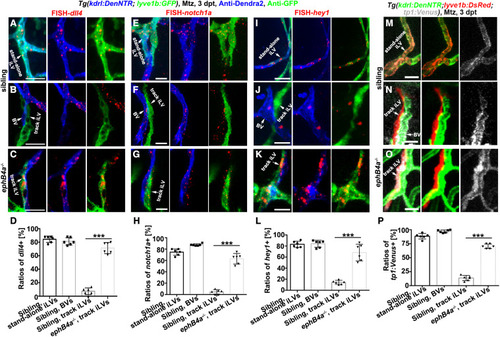
Figure 4. Defective EphB4a leads to derepression of Notch in the track iLVs (A–L) Triple labeling of anti-Dendra2, anti-GFP, and FISH-dll4 (A–C)/notch1a (E–G)/hey1 (I–K). In the siblings, dll4/notch1a/hey1 were activated in the Dendra2+GFP+ stand-alone iLVs (A, E, and I) and Dendra2+GFP− nascent BVs (B, F, and J), but not in the Dendra2−GFP+ track iLVs (B, F, and J). By contrast, in the ephB4a mutant, the Dendra2−GFP+ track iLVs at 3 dpt also exhibited dll4, notch1a, and hey1 expressions (C, G, and K). The statistics show the dll4/notch1a/hey1 expression in the vessels of sibling and ephB4a mutant (D, H, and L) (n = 6 larvae; two-tailed unpaired t test; ∗∗∗, p < 0.0001). (M–P) The Notch functional reporter tp1:Venus was activated in the Dendra2+DsRed+ stand-alone iLVs (M) and Dendra2+DsRed− nascent BVs (N), but not in the Dendra2−DsRed+ track iLVs (N). By contrast, in the ephB4a mutant, the Dendra2−DsRed+ track iLVs at 3 dpt also exhibited Venus expression (O). The statistics show the tp1:Venus expression in the vessels of siblings and ephB4a mutants (P) (n = 6 larvae; two-tailed unpaired t test; ∗∗∗, p < 0.0001). Scale bar, 20 μm. Data are represented as mean ± SD. See also Figures S6 and S7. |
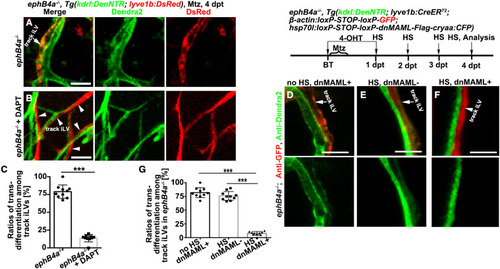
Figure 5. EphB4a represses track iLV transdifferentiation through suppression of Notch (A–C) The derepressed transdifferentiation of track iLV (Dendra2+DsRed+) in the ephB4a mutant (A, arrow) was rescued by treatment with DAPT, which returned to Dendra2−DsRed+ (B, arrowheads). The statistics show the ratios of transdifferentiation among track iLVs in the ephB4a mutant with or without DAPT treatment (C) (n = 10 larvae; two-tailed unpaired t test; ∗∗∗, p < 0.0001). (D–G) The derepressed transdifferentiation of track iLV (Dendra2+GFP+) in the ephB4a mutant without heat shock (D, arrow) or without dnMAML-Flag (E, arrow) was rescued by the heat-shock-induced, LEC-specific overexpression of dnMAML-Flag, which exhibited Dendra2−GFP+ at 4 dpt (F, arrowhead). The statistics show the ratios of transdifferentiation among track iLVs in the ephB4a mutant groups (G) (n = 10 larvae; two-tailed unpaired t test; ∗∗∗, p < 0.0001). Scale bar, 20 μm. Data are represented as mean ± SD. HS, heat shock. See also Figures S6 and S7. |
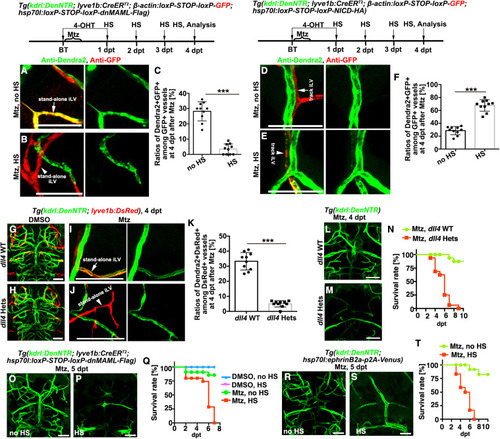
Figure 6. The stand-alone iLV-to-BV transdifferentiation is dependent on Notch and critical for postinjury survival (A–C) Transdifferentiation of the stand-alone iLVs (A, arrow) was inhibited by the LEC-specific overexpression of dnMAML-Flag (B, arrowhead). The statistics show the ratios of Dendra2+GFP+ vessels among all the GFP+ vessels (C) (n = 10 larvae; two-tailed unpaired t test; ∗∗∗, p < 0.0001). (D–F) The track iLVs (D, arrows) were induced to undergo LV-to-BV transdifferentiation by the LEC-specific overexpression of NICD-HA (E, arrowhead). The statistics show the ratios of Dendra2+GFP+ vessels among all the GFP+ vessels (F) (n = 10 larvae; two-tailed unpaired t test; ∗∗∗, p < 0.0001). (G–K) In contrast to the wild-type (G), the uninjured dll4 heterozygotes (H) were physiologically normal including brain BVs and BLECs. But after Mtz treatment, the stand-alone iLV-to-BV transdifferentiation (I, arrow) failed to occur in the dll4 heterozygotes (J, arrowhead). The statistics show ratios of Dendra2+GFP+ vessels among all the GFP+ vessels (K) (n = 10 larvae; two-tailed unpaired t test; ∗∗∗, p < 0.0001). (L–T) The dll4 heterozygotic mutation (L–N), the LEC-specific overexpression of dnMAML-Flag (O–Q), and general overexpression of EphrinB2a (R–T), led to defects in the formation of early-regenerated BVs and became lethal. The statistics show the survival rates (N, n = 32; Q, n = 40; T, n = 36). Note that the majority of the larvae with defective formation of early-regenerated BVs died before 6 dpt, while all of them died by 7 dpt. Scale bar, 50 μm. Data are represented as mean ± SD. Hets, heterozygotes; HS, heat shock. See also Figures S6 and S7. |
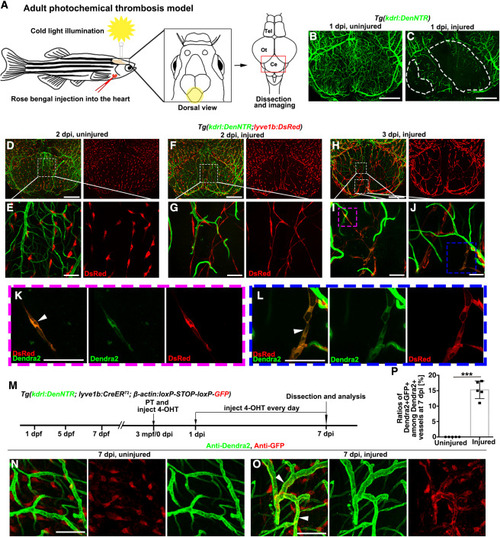
Figure 7. The iLV-to-BV conversion is conserved in the adult photochemical thrombosis model (A) Illustrations of the cold light-induced thrombosis in the zebrafish brain. The yellow circle and red frame indicate the illuminated and imaged cerebellum areas, respectively. Tel, telencephalon; Ot, optic tectum; Ce, Cerebellum. (B and C) In contrast to the uninjured control (B), damage to the cerebellar blood vasculature was observed at 1-day post illumination (C). The dashed lines mark the injured areas (n = 10 adult brains). (D–G) At 2 dpi, in contrast to the interspersed distribution of BLECs on the surface of uninjured brain (D and E), ingrowth of BLECs into the injured area to form iLVs was observed (F and G). The framed areas in (D) and (F) are enlarged in (E) and (G), respectively. n = 10 adult brains. (H–L) At 3 dpi, a portion of lyve1b+ iLVs in the injured cerebellum co-expressed the BEC-specific Dendra2 (K, L, arrowheads). From (H) to (I) and (J), then to (K) and (L), sequential enlargements of the framed areas are shown. n = 10 adult brains. (M–P) Transgenic lines, time points of photochemical thrombosis (PT) and 4-OHT administration (M). In contrast to the uninjured adult brain (N, injected rose bengal without cold light illumination, then injected 4-OHT from 0 to 7 dpi every day), a portion of BVs were double positive for anti-GFP and anti-Dendra2 in the injured brain at 7 dpi (O, arrowheads). The statistics show the ratios of Dendra2+GFP+ vessels among all the Dendra2+ blood vessels at 7 dpi (P) (n = 5 regions from 5 different adult brains; two-tailed unpaired t test; ∗∗∗, p < 0.0001). Scale bars in (B), (C), (D), (F), and (H): 200 μm; Scale bars in (E), (G), (I–L), (N), and (O): 50 μm. Data are represented as mean ± SD. |
Reprinted from Developmental Cell, 56(22), Chen, J., Li, X., Ni, R., Chen, Q., Yang, Q., He, J., Luo, L., Acute brain vascular regeneration occurs via lymphatic transdifferentiation, 3115-3127.e6, Copyright (2021) with permission from Elsevier. Full text @ Dev. Cell