
Fig. 2
- ID
- ZDB-IMAGE-221222-9
- Publication
- Chen et al., 2021 - Acute brain vascular regeneration occurs via lymphatic transdifferentiation
- All Figures
- Figures for Chen et al., 2021
|
Fig. 2
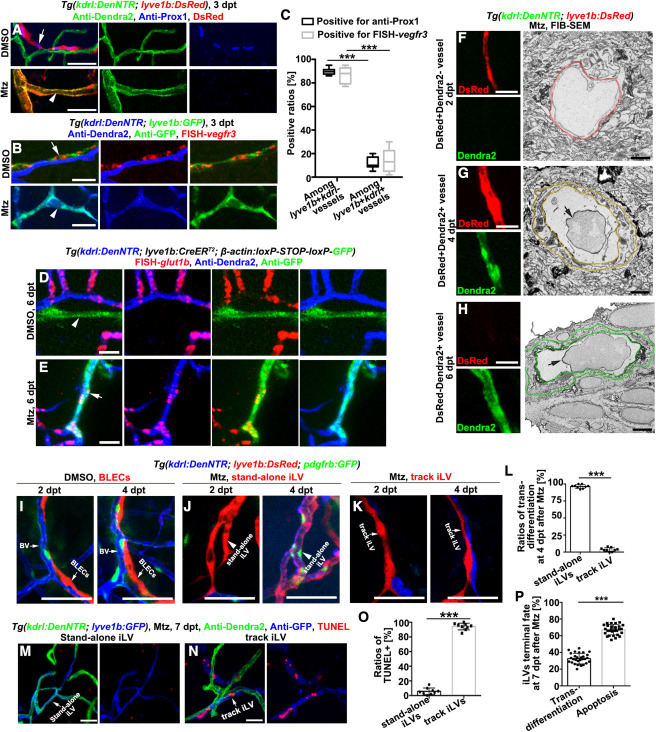
Figure 2. The transdifferentiating iLVs switch molecular and structural identities and are restricted to stand-alone iLVs (A–C) The lyve1b+kdrl− BLECs in the uninjured control (arrows), but not the transdifferentiating lyve1b+kdrl+ iLVs at 3 dpt after injury (arrowheads), were positive for anti-Prox1 (A) and fluorescence in situ hybridization (FISH)-vegfr3 (B). The statistics show the ratios of vessels positive for anti-Prox1 or FISH-vegfr3 among all the lyve1b+kdrl− vessels and all the lyve1b+kdrl+ vessels. (C) (n = 6 larvae; two-way ANOVA by Dunnett’s multiple comparisons test; ∗∗∗, p < 0.0001). Scale bar, 20 μm. (D and E) Positive control brain BVs in the uninjured larvae (D), the lineage-tracing system indicated that the vessels double positive for GFP and Dendra2 (E, arrow) and single positive for Dendra2 (D and E) expressed the blood-brain barrier marker glut1b, but vessels single positive for GFP (D, arrowhead) did not. Scale bar, 20 μm. (F–H) Single FIB-SEM image planes (right row) indicate cross sections of the vessels shown in the left row. Note that the mural of the DsRed+Dendra2+ vessel (G) is similar to the DsRed-Dendra2+ BV (H) but much thicker than the DsRed+Dendra2− iLV (F). Color rings mark the inner and outer surfaces of murals. Arrows indicate blood cells. Scale bars, 20 and 1 μm. (I–L) Live imaging shows BLECs (I), stand-alone iLVs (J, arrows), and track iLVs (K) at 2 and 4 dpt. Note that only the stand-alone iLVs express Dendra2 and recruit the GFP+ pericytes at 4 dpt (J, arrowheads). (L) The statistics show the ratios of transdifferentiation in the stand-alone iLVs and track iLVs at 4 dpt (n = 9 larvae; two-tailed unpaired t test; ∗∗∗, p < 0.0001). Scale bar, 50 μm. (M–P) The TUNEL signals in the stand-alone iLVs (M) and track iLVs (N) at 7 dpt. The statistics show the ratios of TUNEL+ cells in stand-alone iLVs and in track iLVs (O) (n = 9 larvae; ∗∗∗, p < 0.0001), and the ratios of iLVs undergoing transdifferentiation (Dendra2+GFP+) or undergoing apoptosis (GFP+TUNEL+) among all the iLVs at 7 dpt (P) (n = 30 larvae; two-tailed unpaired t test; ∗∗∗, p < 0.0001). Scale bar, 50 μm. Data are represented as mean ± SD. See also Figure S2.
Reprinted from Developmental Cell, 56(22), Chen, J., Li, X., Ni, R., Chen, Q., Yang, Q., He, J., Luo, L., Acute brain vascular regeneration occurs via lymphatic transdifferentiation, 3115-3127.e6, Copyright (2021) with permission from Elsevier. Full text @ Dev. Cell