
Fig. 3
- ID
- ZDB-IMAGE-221222-10
- Publication
- Chen et al., 2021 - Acute brain vascular regeneration occurs via lymphatic transdifferentiation
- All Figures
- Figures for Chen et al., 2021
|
Fig. 3
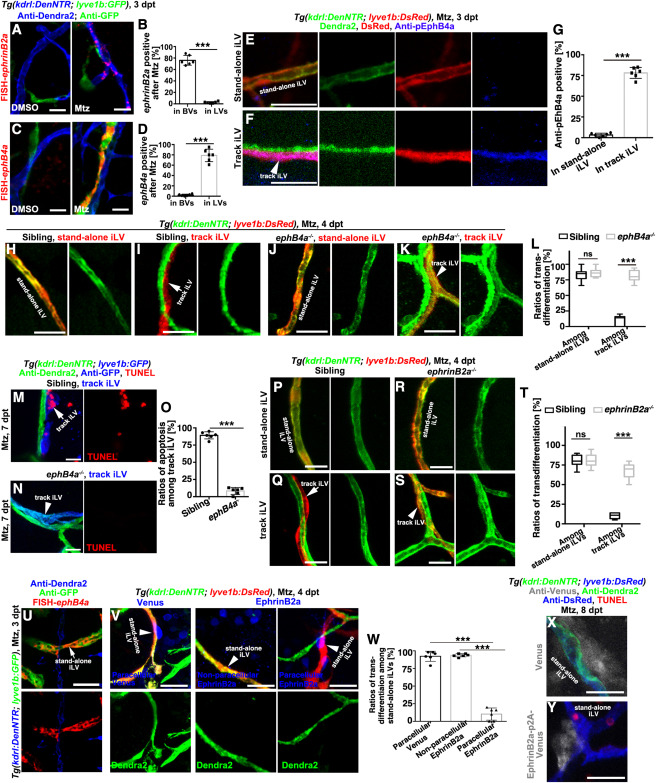
Figure 3. EphrinB2a/EphB4a are necessary and sufficient to inhibit the iLV-to-BV transdifferentiation (A–D) In contrast to their absence in the brain of uninjured control, ephrinB2a and ephB4a were, respectively, activated in the Dendra2+GFP− BVs and Dendra2−GFP+LVs after Mtz treatment (A and C). The statistics show ephrinB2a and ephB4a expression in the vessels, respectively (B and D) (n = 6 larvae; two-tailed unpaired t test; ∗∗∗, p < 0.0001). (E–G) In contrast to the stand-alone iLV (E), expression of the tyrosine-phosphorylated EphB4 (pEphB4) indicate the activation of EphB4a in the track iLVs of the injured brain (F). The statistics show the ratios of pEphB4-positive among stand-alone and track iLVs (G) (n = 6 larvae; two-tailed unpaired t test; ∗∗∗, p < 0.0001). (H–L) After Mtz treatment, the stand-alone iLV (H) underwent transdifferentiation in siblings, but the track iLVs (I, arrow) did not. In the ephB4a mutant, both stand-alone (J) and track iLVs expressed Dendra2 (K, arrowhead). The statistics show the ratios of transdifferentiation among stand-alone iLVs and track iLVs in siblings and in the ephB4a mutant (L) (n = 7 larvae; two-way ANOVA by Sidak’s multiple comparisons test; ns, p = 0.7299; ∗∗∗, p < 0.0001). See also Video S6. (M–O) After Mtz treatment, the track iLVs finally underwent apoptosis (M, arrow). In the ephB4a mutant, the track iLVs expressed Dendra2 and became TUNEL-negative (N, arrowhead). The statistics show the ratios of apoptosis among the track iLVs in sibling and in the ephb4a mutant (O) (n = 6 larvae; two-tailed unpaired t test; ∗∗∗, p < 0.0001). (P–T) In contrast to siblings (Q, arrow), the track iLVs in the ephrinB2a mutant expressed Dendra2 (S, arrowhead), whereas the transdifferentiation of stand-alone iLVs remained unaffected (P and R). The statistics show the ratios of transdifferentiation among stand-alone iLVs and track iLVs in sibling and in the ephrinB2a mutant (T) (n = 7 larvae; two-way ANOVA by Sidak’s multiple comparisons test; ns, p = 0.9675; ∗∗∗, p < 0.0001). (U–W) The ephB4a expressed in the stand-alone iLVs after Mtz treatment (U). The paracellularly expressed EphrinB2a, repressed the Dendra2 expression in the stand-alone iLVs (V), but the nonparacellular EphrinB2a or paracellular Venus did not. The statistics show the ratios of transdifferentiation in the subpopulations of stand-alone iLVs (W) (n = 6 larvae; two-tailed unpaired t test; ∗∗∗, p < 0.0001). (X and Y) The paracellularly expressed EphrinB2a (Y) caused apoptosis of the stand-alone iLVs, but Venus (X) did not. Scale bar, 20 μm. NS, not significant. Data are represented as mean ± SD. See also Figures S3, S4, S5, and S7.
Reprinted from Developmental Cell, 56(22), Chen, J., Li, X., Ni, R., Chen, Q., Yang, Q., He, J., Luo, L., Acute brain vascular regeneration occurs via lymphatic transdifferentiation, 3115-3127.e6, Copyright (2021) with permission from Elsevier. Full text @ Dev. Cell