
- Title
-
A complete Protocadherin-19 ectodomain model for evaluating epilepsy-causing mutations and potential protein interaction sites
- Authors
- Hudson, J.D., Tamilselvan, E., Sotomayor, M., Cooper, S.R.
- Source
- Full text @ Structure

Figure 1. Structural features of dr Pcdh19 EC3-6 (A) Ribbon diagram of dr Pcdh19 EC3-6 is shown with a backdrop of the protein’s molecular surface representation. (B) A topology diagram represents the structural features of dr Pcdh19 EC3-6. β strands are drawn as arrows and labeled A through G. Helices are drawn as rectangles and labeled as α (α helix) or 310 (310 helix). Green and yellow circles are Ca2+ and Na+ ions, respectively. (C and D) Details of linker regions with canonical (C) and non-canonical Ca2+-binding motifs (D) are shown. Residues referred to in the main text have yellow colored carbons. (E) Na+ ion coordination within EC3. (F) Details of a β bridge located in the β strand A of EC6. β strand A contains three segments labeled A′, A″, and A‴. Select residues have yellow colored carbon atoms to aid in visualization of the β bridge structure. (G) Molecular surface representation of dr Pcdh19 EC3-6 with residues colored based on chemical properties: hydrophobic (white), polar (green), acidic (red), and basic (blue). Highly hydrophobic regions are highlighted by boxes with dashed outlines. In (A) and (C)–(E), Ca2+ (green) and Na+ (yellow) ions are shown as spheres, and stick representations are used for ion-coordinating side chains. The subscript “C” indicates only the backbone carbonyl for that residue is shown; the subscript “B” indicates the entire backbone is shown. See also Figures S1–S5. |

Figure 2. The composite structure of Pcdh19 with its complete extracellular domain Our structural model of Pcdh19 is shown mediating adhesion between two adjacent cells. Extracellular domains are shown in surface representation from the composite structure (Data S1), which is based on dr Pcdh19 EC1-4 (PDB: 5IU9) and dr Pcdh19 EC3-6 (PDB: 6PGW). The transmembrane segment is represented by a helical coil and the intrinsically disordered intracellular segment is shown fading out of view. See also Figure S6 and the STAR Methods. |

Figure 3. Comparison between protocadherins reveals similar overall architecture but variable EC linker angle and loop structures (A) xl Pcdh8 and mm PCDHγB4 are aligned with the composite dr Pcdh19 EC1-6. The backbone of each protein is traced and colored according to the legend. (B–D) Each EC repeat was aligned individually to observe subtle differences in the cadherin folds. In (B), the full ectodomain is shown, whereas in (C and D) each image is cropped to view the aligned EC along with a small portion of the adjoining repeats. In all images, the top is toward the N-terminal side and the bottom is toward the C-terminal side. Brackets highlight regions that are different between these protocadherins. An arrowhead points to a region of interest that is essentially identical between the three structures. (C and D) are rotated approximately 90° around the vertical axis relative to one another to allow the best viewing of variations. Additional details are given in Data S2, Figure S7, and the STAR Methods. |
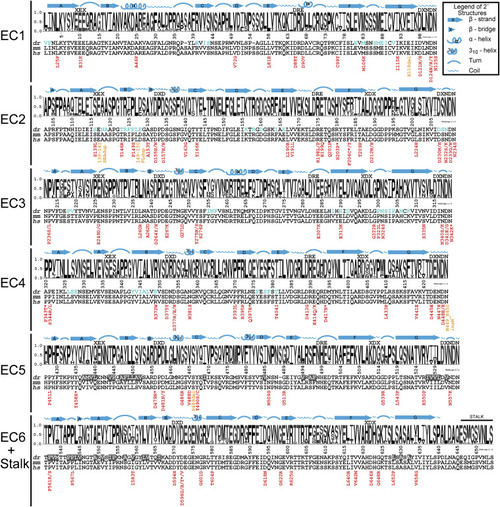
Figure 4. Ectodomain epilepsy mutations and structural features mapped onto sequence conservation Sequence logos represent the portion of species containing each amino acid by the height of that letter in the stack position (y axis units, probability). The numbering of the x axis represents the mature dr PCDH19 protein (signal peptide already cleaved off), which matches the numbering in the dr PCDH19 structure. Above each logo, the sequences of canonical cadherin repeat motifs are listed, and the secondary structural elements observed in the dr PCDH19 composite structure are drawn. For regions that do not have experimental data indicating secondary structures, features predicted from the protein sequence are labeled above a black line. Sequences for the most common model organisms used to study Pcdh19 (dr, Danio rerio; mm, Mus musculus) are aligned with the human sequence (hs, Homo sapiens). Residues found at the Pcdh19 trans interface (as presented in Cooper et al., 2016) are indicated with blue text in the dr sequence, and residues identified at the hydrophobic patch of dr Pcdh19 are in white text with gray background. Each of the epilepsy-causing mutations is listed below the human sequence with the missense mutations in red and in-frame insertions/duplications in orange. An asterisk denotes a patient with mutations affecting two or more PCDH19 amino acids. See also S5 and Figure S8. |
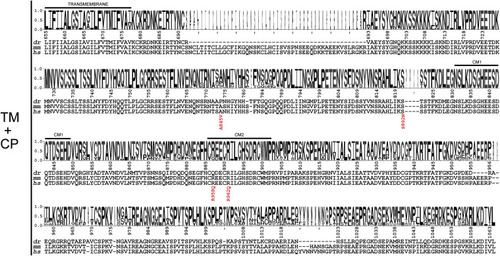
Figure 5. Intracellular epilepsy mutations mapped onto sequence conservation Sequence logos and numbering are represented as in Figure 4 with sequences for the same species aligned underneath. Each of the epilepsy-causing mutations in the intracellular domain is listed below the human sequence. See also Data S4 and S5. |
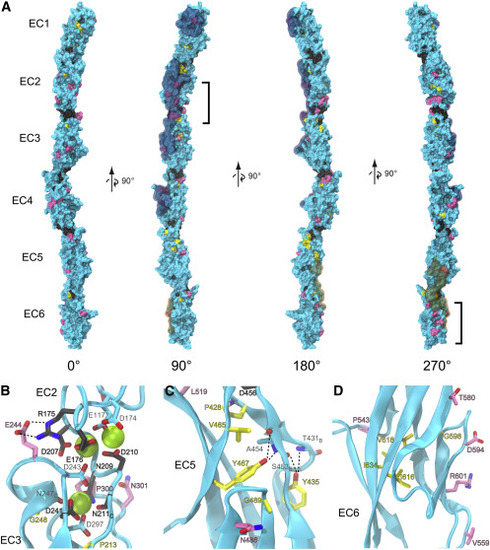
Figure 6. PCDH19-CE mutations may affect Ca2+ binding, core packing, and surface properties of PCDH19 (A) Molecular surface representation of the composite dr Pcdh19 EC1-6 structure. Residues are colored based on the location of corresponding epilepsy mutations: Ca2+-binding motifs (dark gray), hydrophobic core (yellow), and surface (pink). The remaining residues without documented mutations in the literature are colored cyan. Brackets highlight two clusters of surface mutations in EC2 and EC6. Residues observed in the previously documented trans adhesion interface of dr Pcdh19 (Cooper et al., 2016) are highlighted in a semitransparent cyan. The cis interface only observed thus far in clustered protocadherins (Goodman et al., 2017) was mapped onto dr Pcdh19 and highlighted in semitransparent orange. (B–D) Ribbon diagrams highlight details of the EC2-3 linker region (B), EC5 hydrophobic core (C), and EC6 surface residues (D). Side chains are represented in stick for all mutant residues with carbon atoms matching the coloring of (A). Backbone atoms are also shown in stick for some residues. “B” subscripts indicate only the backbone is represented for clarity, and “C” subscripts indicate only the carboxyl group of the backbone is represented. Residue labels are colored according to the mutations category and outlined in black, while other relevant residues without documented mutation have cyan colored carbons and light gray labels. Numbering in the labels corresponds to the structure's numbering, and corresponding numbering of the human mutations can be found in Figure 4 and Data S4. Dashed lines depict hydrogen bonding discussed in the main text. |
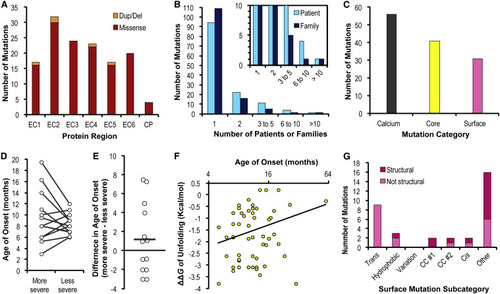
Figure 7. Distribution and correlations of PCDH19-CE mutations (A) The stacked bar graph depicts the distribution of mutations causing unique changes at the protein level with contributions from missense mutations (red) and in-frame deletions/duplications (orange), matching the coloring in Figures 4 and 5. The remainder of the statistics focus on the missense mutations. (B) The clustered bar graph shows most mutations have been documented in the literature for only a single patient (cyan) or a single family (dark blue). Inset shows the same plot at a different scale for clarity. (C) The standard bar graph depicts the number of extracellular missense mutations in each category, which are further analyzed in (D) calcium, (E) calcium, (F) core, and (G) surface. (D) Missense mutations at Ca2+-binding residues were paired and categorized as more or less severe relative to one another. A scatterplot represents the average age of onset for each mutation and a line connects each of the paired data points. Error bars are not shown, since most of the mutations only have a single patient documented in the literature. (E) The univariate scatterplot represents the difference in the age of onset for each of the 13 pairs (more severe minus less severe). The average difference was +1.2 (horizontal line) with a two-tailed p value of 0.263. (F) The scatterplot analyzes the relationship between a mutation’s impact on the free energy of unfolding and the age of epilepsy onset in patients (n = 59). Pearson's correlation and Spearman's rank correlation indicates low correlation (r = 0.21 and rho = 0.22), and do not meet the level of statistical significance (two-tailed p values are 0.109 and 0.093, respectively). The x axis is logarithmic to spread out the otherwise left skewed variable. (G) Surface mutations are further subcategorized based on features described in the main text. Within each subcategory, mutations that already have an explanation based on disruption of structural features are colored in dark pink, whereas those unexplained by structural disruption likely affect surface properties are light pink. See Data S4 and S6 for plotted values. |
Reprinted from Structure (London, England : 1993), 29(10), Hudson, J.D., Tamilselvan, E., Sotomayor, M., Cooper, S.R., A complete Protocadherin-19 ectodomain model for evaluating epilepsy-causing mutations and potential protein interaction sites, 1128-1143.e4, Copyright (2021) with permission from Elsevier. Full text @ Structure