
Fig. 7
- ID
- ZDB-FIG-221121-7
- Publication
- Hudson et al., 2021 - A complete Protocadherin-19 ectodomain model for evaluating epilepsy-causing mutations and potential protein interaction sites
- Other Figures
- All Figure Page
- Back to All Figure Page
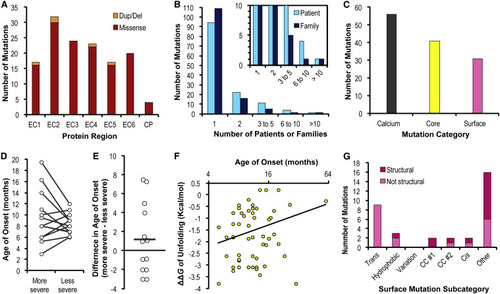
Figure 7. Distribution and correlations of PCDH19-CE mutations (A) The stacked bar graph depicts the distribution of mutations causing unique changes at the protein level with contributions from missense mutations (red) and in-frame deletions/duplications (orange), matching the coloring in Figures 4 and 5. The remainder of the statistics focus on the missense mutations. (B) The clustered bar graph shows most mutations have been documented in the literature for only a single patient (cyan) or a single family (dark blue). Inset shows the same plot at a different scale for clarity. (C) The standard bar graph depicts the number of extracellular missense mutations in each category, which are further analyzed in (D) calcium, (E) calcium, (F) core, and (G) surface. (D) Missense mutations at Ca2+-binding residues were paired and categorized as more or less severe relative to one another. A scatterplot represents the average age of onset for each mutation and a line connects each of the paired data points. Error bars are not shown, since most of the mutations only have a single patient documented in the literature. (E) The univariate scatterplot represents the difference in the age of onset for each of the 13 pairs (more severe minus less severe). The average difference was +1.2 (horizontal line) with a two-tailed p value of 0.263. (F) The scatterplot analyzes the relationship between a mutation’s impact on the free energy of unfolding and the age of epilepsy onset in patients (n = 59). Pearson's correlation and Spearman's rank correlation indicates low correlation (r = 0.21 and rho = 0.22), and do not meet the level of statistical significance (two-tailed p values are 0.109 and 0.093, respectively). The x axis is logarithmic to spread out the otherwise left skewed variable. (G) Surface mutations are further subcategorized based on features described in the main text. Within each subcategory, mutations that already have an explanation based on disruption of structural features are colored in dark pink, whereas those unexplained by structural disruption likely affect surface properties are light pink. See Data S4 and S6 for plotted values. |
Reprinted from Structure (London, England : 1993), 29(10), Hudson, J.D., Tamilselvan, E., Sotomayor, M., Cooper, S.R., A complete Protocadherin-19 ectodomain model for evaluating epilepsy-causing mutations and potential protein interaction sites, 1128-1143.e4, Copyright (2021) with permission from Elsevier. Full text @ Structure