
|
Fig. 1
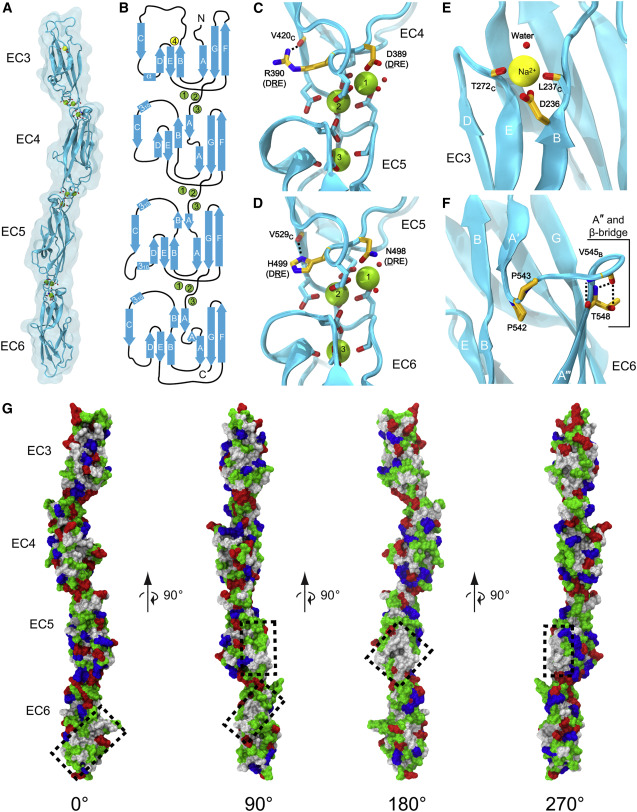
Figure 1. Structural features of dr Pcdh19 EC3-6 (A) Ribbon diagram of dr Pcdh19 EC3-6 is shown with a backdrop of the protein’s molecular surface representation. (B) A topology diagram represents the structural features of dr Pcdh19 EC3-6. β strands are drawn as arrows and labeled A through G. Helices are drawn as rectangles and labeled as α (α helix) or 310 (310 helix). Green and yellow circles are Ca2+ and Na+ ions, respectively. (C and D) Details of linker regions with canonical (C) and non-canonical Ca2+-binding motifs (D) are shown. Residues referred to in the main text have yellow colored carbons. (E) Na+ ion coordination within EC3. (F) Details of a β bridge located in the β strand A of EC6. β strand A contains three segments labeled A′, A″, and A‴. Select residues have yellow colored carbon atoms to aid in visualization of the β bridge structure. (G) Molecular surface representation of dr Pcdh19 EC3-6 with residues colored based on chemical properties: hydrophobic (white), polar (green), acidic (red), and basic (blue). Highly hydrophobic regions are highlighted by boxes with dashed outlines. In (A) and (C)–(E), Ca2+ (green) and Na+ (yellow) ions are shown as spheres, and stick representations are used for ion-coordinating side chains. The subscript “C” indicates only the backbone carbonyl for that residue is shown; the subscript “B” indicates the entire backbone is shown. See also Figures S1–S5.
Reprinted from Structure (London, England : 1993), 29(10), Hudson, J.D., Tamilselvan, E., Sotomayor, M., Cooper, S.R., A complete Protocadherin-19 ectodomain model for evaluating epilepsy-causing mutations and potential protein interaction sites, 1128-1143.e4, Copyright (2021) with permission from Elsevier. Full text @ Structure