
|
Fig. 3
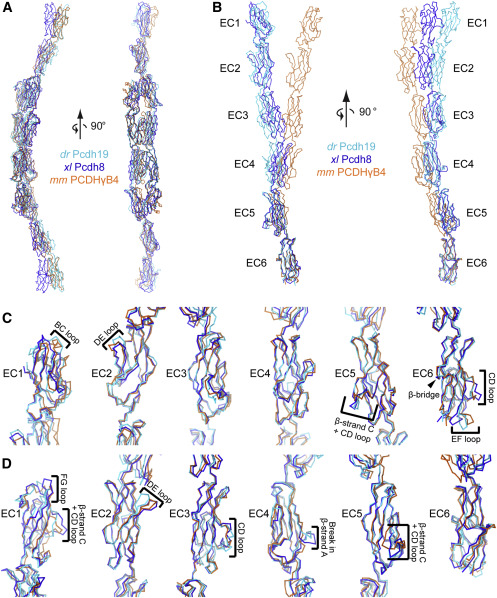
Figure 3. Comparison between protocadherins reveals similar overall architecture but variable EC linker angle and loop structures (A) xl Pcdh8 and mm PCDHγB4 are aligned with the composite dr Pcdh19 EC1-6. The backbone of each protein is traced and colored according to the legend. (B–D) Each EC repeat was aligned individually to observe subtle differences in the cadherin folds. In (B), the full ectodomain is shown, whereas in (C and D) each image is cropped to view the aligned EC along with a small portion of the adjoining repeats. In all images, the top is toward the N-terminal side and the bottom is toward the C-terminal side. Brackets highlight regions that are different between these protocadherins. An arrowhead points to a region of interest that is essentially identical between the three structures. (C and D) are rotated approximately 90° around the vertical axis relative to one another to allow the best viewing of variations. Additional details are given in Data S2, Figure S7, and the STAR Methods.
Reprinted from Structure (London, England : 1993), 29(10), Hudson, J.D., Tamilselvan, E., Sotomayor, M., Cooper, S.R., A complete Protocadherin-19 ectodomain model for evaluating epilepsy-causing mutations and potential protein interaction sites, 1128-1143.e4, Copyright (2021) with permission from Elsevier. Full text @ Structure