
- Title
-
Apical contacts stemming from incomplete delamination guide progenitor cell allocation through a dragging mechanism
- Authors
- Pulgar, E., Schwayer, C., Guerrero, N., López, L., Márquez, S., Härtel, S., Soto, R., Heisenberg, C.P., Concha, M.
- Source
- Full text @ Elife
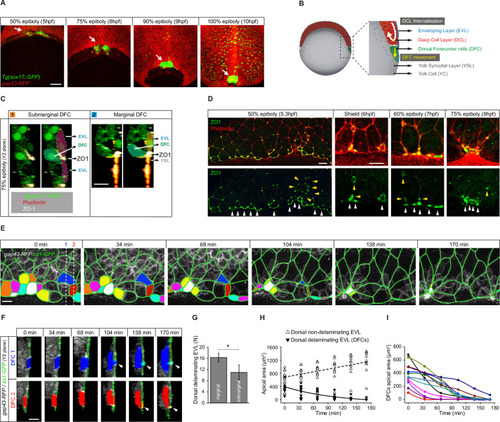
(A) Dorsal views of confocal z-stack maximum projections showing the collective vegetal movement of DFCs between shield stage and 100% epiboly in a representative Tg(sox17::GFP) embryo injected with gap43-RFP mRNA. DFCs are in green (arrows) while the plasma membrane of all cells is in red. Note that the sox17::GFP transgene also labels the scattered population of endodermal cells at advanced stages of epiboly (see criteria to discriminate DFCs from endodermal cells in Material and methods) (extracted from Figure 1—video 1). Scale bar, 100 µm. (B) Schematic diagram of a cross section along the sagittal plane of the zebrafish embryo at 60% of epiboly. DFCs move to the vegetal pole ahead of the deep cell layer (DCL) margin, where mesendodermal progenitors internalise. (C) Confocal microscopy zy-plane of a 75% epiboly Tg(sox17::GFP) embryo (green) stained with phalloidin (red) and zonula occludens one protein (ZO-1) (white), showing submarginal (left) and marginal (right) DFCs connected with the EVL and YSL by focal apical attachments enriched in ZO-1 and F-actin (extracted from Figure 1—figure supplement 1). Scale bar, 20 µm. (D) Phalloidin and ZO-1 immunostaining (merge on top and ZO-1 on bottom) of the dorsal margin of wild-type embryos between 50% and 75% epiboly. Images correspond to surface confocal sections showing the apical domains of marginal (white arrowheads) and submarginal (yellow arrowheads) delaminating DFCs in contact with the YSL and EVL. Scale bar, 20 µm. (E) Time series of dorsal views of confocal z-stack maximum projections of a representative embryo injected with zo1-GFP and gap43-RFP between 50% and 80% epiboly, showing EVL cell junctions (green outlines) and the apical domains of EVL cells as they delaminate to become DFCs (coloured areas) (extracted from Figure 1—video 2). Scale bar, 20 µm. (F) Time series of confocal z-sections showing two delaminating EVL cells (DFCs) taken from panel E in lateral views (blue and red cells) as they move below the plane of the EVL epithelium during the process of delamination. Note that delaminating cells retain a focal apical attachment with the EVL (arrowhead, top) and YSL (arrowhead, bottom). Scale bar, 20 µm. (G) Quantification of the number of dorsal EVL cells undergoing delamination to become DFCs at both marginal and submarginal positions, expressed as means ± s.d. *p ≤ 0.05 (n = 49 marginal DFCs and 33 submarginal DFCs from three embryos). (H) Temporal changes in apical area of delaminating dorsal EVL cells (DFCs) (black triangles) and neighbouring non-delaminating dorsal EVL cells (white triangles) in a representative embryo during the process of delamination (n = 12 DFCs and 11 dorsal EVL cells from the representative embryo shown in E). Continuous and dashed lines indicate the mean values of apical area of delaminating and non-delaminating dorsal EVL cells, respectively. (I) Temporal changes in apical area of individual delaminating DFCs in a representative embryo during the process of delamination (n = 12 delaminating DFCs from the representative embryo shown in E). Each curve corresponds to a single cell. Animal is to the top in all image panels. Source data for all plots are provided in Figure 1—source data 1.
|
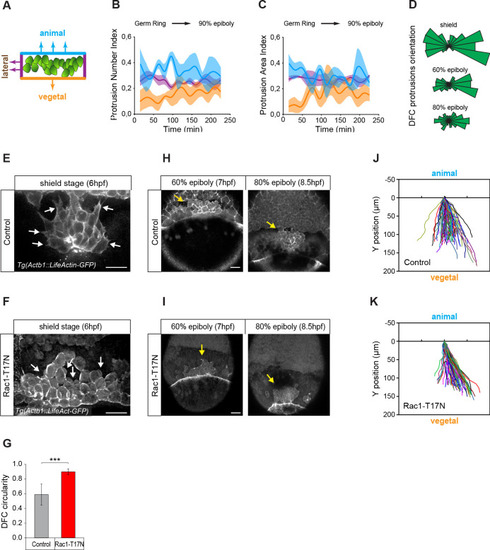
(A) Schematic representation of the DFC cluster showing how cell protrusions extending from the vegetal (orange), lateral (purple), and animal (light blue) edges of the cluster were quantified in Tg(actb1::lifeactin-RFP) embryos to build the plots of (B) and (C). (B) Kinetic of normalised DFC protrusion number in living embryos (n = 3 embryos). (C) Kinetic of normalised DFC protrusion area in living embryos (n = 3 embryos). (D) Circular distribution plots of DFC protrusion orientation at different developmental stages obtained from fixed Tg(sox17::utrn-GFP) embryos (n = 11, 10, and 9 embryos for shield, 60% epiboly and 80% epiboly, respectively). (E, F) Dorsal views of confocal z-stack maximum projections showing the protrusions formed in DFCs (white arrows) from representative living Tg(actb1::lifeactin-RFP) embryos at shield stage in control (E) and Rac1-T17N injected (F) conditions. Scale bar, 20 µm. (G) Plot of circularity index of DFC protrusions in control and Rac1-T17N injected embryos, expressed as means ± s.d. ***p ≤ 0.001 (n = 42 cells from two control embryos and 62 cells from 3 Rac1-T17N embryos). (H, I) Dorsal views of confocal z-stack maximum projections showing the vegetal movement of the DFC cluster (yellow arrows) from representative living Tg(actb1:lifeactin-RFP) embryos from 60% to 80% epiboly stages in control (H) and Rac1-T17N injected (I) conditions. Scale bar, 20 µm. (J, K) Tracking plots of DFC movement in control (J) and Rac1-T17N injected (K) conditions, showing the directional movement of DFCs (n = 2 embryos for control and 3 embryos for Rac1-T17N injected conditions). Animal is to the top in all image panels. Source data for all plots are provided in Figure 2—source data 1.
|
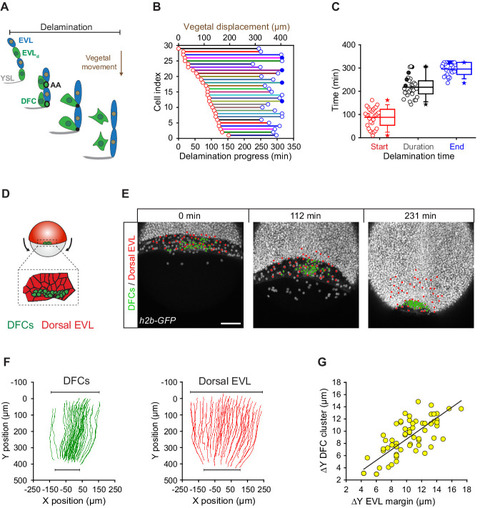
(A) Schematic diagram showing the origin of DFCs from the EVL through cell delamination. Apical attachments (AA) that result from apical constriction connect delaminating DFCs with the EVL and YSL during their vegetal movements. When DFCs complete delamination, they lose apical attachments and are released from the EVL and YSL. (B) Plot depicting the relationship between the time of the DFC delamination process and the vegetal movements of delaminating cells for all cells in a single representative Tg(actb1::lifeactin-RFP) embryo. The start (red circles) and end (blue circles) times of cell delamination, and the total duration of this process (horizontal lines) are shown for individual delaminating cells (bottom axis) and compared with their vegetal movements (top axis). Filled blue circles indicate a subset of delaminating cells that still retained their apical attachments by the end of the movies (n = 29 delaminating cells from one representative embryo). (C) Combined box and distribution plots of the start and end times, and of the total duration of cell delamination for the same representative embryo as in B. Circles correspond to individual values while the box depicts the interquartile range from 25% to 75% of the data around the average (vertical line inside the box), the whisker depicts s.d., and stars indicate maximum and minimum values. Filled blue and black circles indicate the subsets of delaminating cells that still retained apical attachments by the end of the movies (n = 29 delaminating cells from one representative embryo, same as in B). (D–G) Delaminating DFC mirrors the movement of dorsal EVL cells. Schematic diagram (D) and dorsal views of confocal z-stack maximum projections (E) of a representative wild-type embryo injected with h2b-GFP mRNA to label all nuclei (white dots) (extracted from Figure 3—video 1). (F) Tracks of delaminating cells (DFCs, green) and neighbouring non-delaminating dorsal EVL cells (red) between shield stage and 90% of epiboly, showing the paths of vegetal movement and convergence. (G) Correlation plot between the changes in position along the y-axis of the centre of mass of the DFC cluster and the EVL margin (Pearson’s r = 0.97552) (n = 62 tracked delta time points from three embryos). Scale bar, 100 µm. Animal is to the top in all image panels. Source data for all plots are provided Figure 3—source data 1.
|
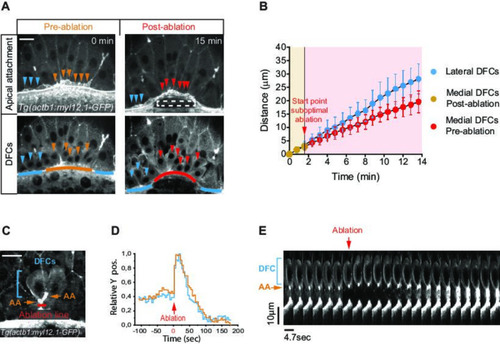
(A, B) Laser disruption of the yolk syncytial layer (YSL) actomyosin network impairs DFC vegetal movements. (A) Dorsal views of a Tg(actb1::myl12.1-GFP) embryo at early shield stage (5.8 hpf) before and after laser ablation of the cortical actomyosin ring of the YSL (extracted from Figure 4—video 1). Confocal optical planes are at the level of the enveloping layer (EVL) to reveal the apical attachments (top) and at a deeper z-position to show the body (bottom) of delaminating DFCs. The dashed rectangle depicts the zone of laser ablation. Arrowheads point to apical attachments (top) and the nuclei of individual DFCs (bottom), while lines depict the position of the EVL margin immediately above the ablation zone (orange and red) and lateral to this region (blue). Scale bar, 20 μm. (B) Plot showing the changes in position of delaminating DFCs along the y-axis before and after ablation, with the pulses of laser ablation starting just before minute 2 (red arrow). Medial and lateral DFCs correspond to the cells shown in panel A (coloured arrowheads), whose apical attachments associate with the EVL/YSL margin above or lateral to the ablated YSL zone, respectively. Values correspond to means ± s.d. (C–E) Laser line ablation of an EVL cortical junction below the apical attachments of two submarginal delaminating DFCs in a Tg(actb1::myl12.1-GFP) embryo at 70% of epiboly. (C) Dorsal view of a pre-ablation stage showing delaminating DFCs (blue bracket), their apical attachments (AA, orange arrows), and the ablation line (red). Scale bar, 20 µm. (D) Plot showing the changes in relative position of delaminating DFCs (blue) and apical attachments (orange) along the y-axis before and after ablation, with zero corresponding to the time of the laser pulse (red arrow). (E) Kymograph showing the movement of a DFC and its apical attachment during the laser ablation plotted in D (extracted from Figure 4—video 2). Scale bar, 10 µm. Animal is to the top in all image panels. Source data for all plots are provided in Figure 4—source data 1.
|
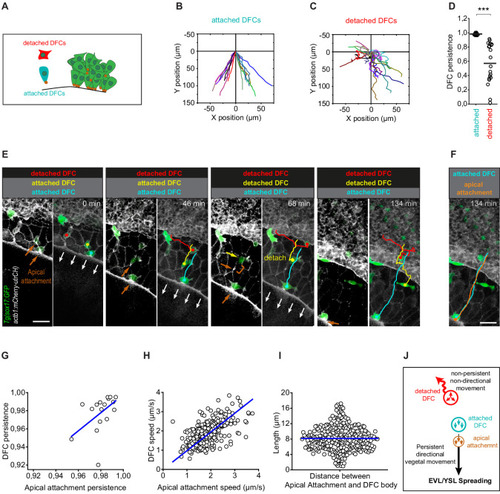
(A) Schematic diagram showing single isolated DFCs transiting the process of delamination far from the main DFC cluster (green). Single isolated DFCs are either transiting delamination and be attached to extra-embryonic tissues (blue cell; attachment shown as a brown dot) or be detached from these tissues after completing delamination (red cell). (B–D) Movement directionality and persistence of single isolated attached and detached DFCs. Tracking plots of single isolated attached (B) and detached (C) DFCs, and the differences in movement persistence (D), obtained from living Tg(sox17::GFP;actb1::mCherry-utrCH) embryos at around 60% epiboly (n = 17 attached DFCs from eight embryos and 20 detached DFCs from eight embryos). *** (p ≤ 0.001). (E) Time series of dorsal views of confocal z-stack maximum projections of a representative living Tg(sox17::GFP;actb1::mCherry-utrCH) embryo starting at 60% of epiboly (extracted from Figure 4—video 3) showing the movement of three DFCs developing as single cells in isolation from the main DFC cluster (see schematic in panel A). The blue cell is attached to the extra-embryonic yolk syncytial layer (YSL) and enveloping layer (EVL) during the entire series. The red cell is detached from these tissues during the entire series. The yellow cell is initially attached to the EVL but at time 68 min completes delamination and detaches from the EVL. Note that after detaching, DFC movement loses persistence and becomes non-directional. Brown arrows show the accumulation of actin at apical attachments. The brown bracket at time 68 min shows the distance between the position of the apical actin accumulation that labelled the recently lost apical attachment and the position of the detached DFC. White arrows show the vegetal movement of the YSL/EVL margin during epiboly. (F) Comparison of the tracks of the movement of the blue attached DFC shown in (E) and the movement of its apical attachment (brown). Scale bar, 50 µm. (G–I) Correlation plots between the movement persistence of DFCs and their apical attachments (G; Pearson’s r = 0.99984; n = 17 attached cells and apical attachments from eight embryos) and between the movement speed of DFCs and their apical attachments (H; Pearson’s r = 0.96085; n = 276 attached cells and apical attachments from eight embryos), and distribution plot of the distance (length) between the apical attachment and body of DFCs (I; n = 276 apical attachments and DFC bodies from eight embryos). (J) Schematic diagram showing the proposed drag-mediated mechanism guiding the motion of attached DFCs. YSL/EVL vegetal spreading is transmitted to delaminating DFCs through apical attachments to guide their vegetal movements. Single isolated DFCs devoid of apical attachments (detached DFCs) are insensible to YSL/EVL dragging and show non-directional movements. Animal is to the top in all image panels. Source data for all plots are provided in Figure 5—source data 1.
|
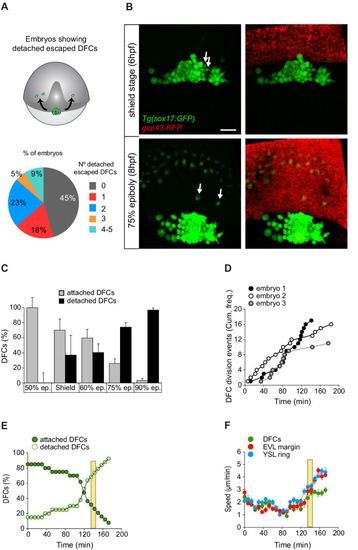
(A, B) Individual detached DFCs can leave the main cluster towards the deep cell layer (DCL) during normal development. (A) Schematic diagram showing events of escape (top) and quantification of the percentage of embryos showing escape events of defined numbers of detached DFCs after in vivo imaging of Tg(sox17::GFP) embryos (bottom, n = 22 embryos). (B) Dorsal views of confocal z-stack maximum projections at shield stage (top) and 75% epiboly (bottom) of a representative Tg(sox17::GFP) embryo injected with gap43-RFP mRNA, labelling DFCs in green and the plasma membrane of all cells in red (extracted from Figure 6—video 1). Arrows indicate two detached DFCs leaving the main cluster towards the DCL. These cells then mimic the behaviour of endodermal cells and differentiate into endodermal tissue derivatives (Figure 6—figure supplement 1). Scale bar, 50 µm. (C–E) Origin and progressive increase of detached DFCs during development. (C) Quantification of attached and detached DFCs between 50% and 90% epiboly (5.3–9 hpf), as determined from fixed embryos stained with phalloidin and zonula occludens one protein (ZO-1) (see Figure 1C and D). Values correspond to means ± s.d. (n = 5–11 embryos per stage). (D) Kinetic of cumulative frequency of DFC division events (n = 3 individual representative embryos). (E) In vivo kinetics of attached and detached DFCs in a single representative living Tg(sox17::GFP) embryo injected with lifeactin-mcherry mRNA to label F-actin. Plot shows the percentage of attached (filled green circles) and detached (empty green circles) DFCs over time. (F) In vivo progression in the movement speed of the centre of mass of the DFC cluster (green), the enveloping layer (EVL) margin (red), and the actomyosin ring of the yolk syncytial layer (YSL) (blue) (n = 10 DFCs, 5 EVL cell margins, and 4 actomyosin ring points from the same representative embryo as in E). Values correspond to means ± s.d. In E and F, movies started at shield stage and extended until 90% epiboly. The vertical yellow bar indicates the stage when the movement of DFCs uncouples from the vegetal movement of the EVL and YSL (around 80% epiboly, when detached DFCs reach ∼80%). Animal is to the top in all image panels. Source data for all plots are provided in Figure 6—source data 1.
|
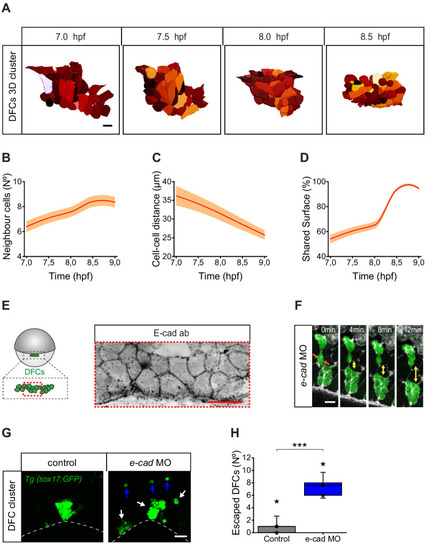
(A) Dorsal view of a 3D cell reconstruction of a single DFC cluster from a Tg(β-actin::HRAS-EGFP) embryo at different time points of collective movement. Individual cells are labelled in different colours according to their volume. Scale bar, 20 µm. (B–D) Quantification plots of the number of neighbour cells (B), and of the distance (C) and shared surface (D) between neighbouring DFCs (n = 44, 46, 47, 59 cells for 7, 7.5, 8, and 8.5 hpf, respectively, from a single embryo). (E) Dorsal view of confocal z-stack maximum projection of a DFC cluster immunostained for E-cadherin (E-cad) in a representative 60% epiboly embryo. Scale bar, 20 µm. (F) Time series of dorsal views of confocal z-stack maximum projections showing the evolution of a small raceme of DFCs in a representative 80% epiboly Tg(sox17::GFP) embryo injected with e-cad MO. The double-sided arrows indicate how the DFC raceme becomes apart as DFCs lose their initial adhesive contacts (arrows). Scale bar, 20 µm. (G) Dorsal views of confocal z-stack maximum projections showing DFCs from representative 80% epiboly Tg(sox17::GFP) control (left) and e-cad MO injected (right) embryos showing the defective collective organisation of DFCs into multiple racemes (white arrows) and the increase of escaped cells (blue arrows). Scale bar, 50 µm. (H) Quantification of the number of DFCs escaping from the central cluster towards the animal pole in control and e-cad MO injected embryos. The box depicts the interquartile range from 25% to 75% of the data around the average (vertical line inside the box), the whisker depicts s.d., and stars indicate maximum and minimum values (n = 5 embryos for e-cad MO and 9 embryos for control conditions). *** (p ≤ 0.001). Animal is to the top in all image panels. Source data for all plots are provided in Figure 7—source data 1.
|
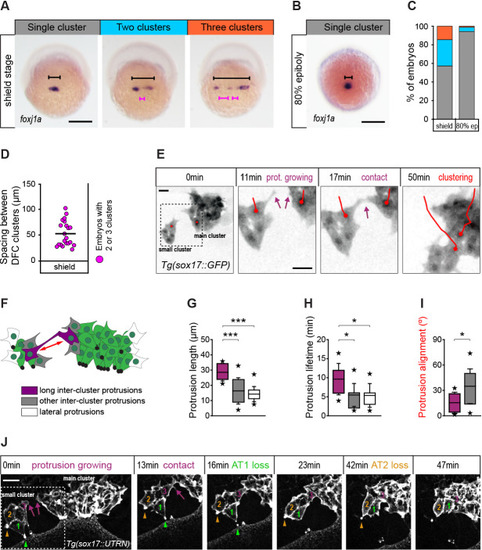
(A) Spatial distribution patterns of DFCs in dorsal views of wild-type embryos at shield stage revealed by foxj1a mRNA expression. During DFC formation, these cells are organised at the dorsal margin as single or multiple clusters spanning different widths (black bracket) along the medio-lateral axis, also showing variable spacing between clusters (purple bracket). (B) Same as in (A) showing an embryo with a single compact cluster (black bracket) at 80% epiboly. Scale bars of A and B, 250 µm. (C) Quantification of the percentage of embryos showing single (grey), two (light blue), or three (orange) DFC clusters at shield stage and at 80% of epiboly (n = 110 embryos at shield stage, and 88 embryos at 80% of epiboly). (D) Quantification of the spacing between DFC clusters at shield stage (n = 16 embryos with two or three clusters). (E) Temporal confocal series of DFCs from a Tg(sox17::GFP) embryo showing long protrusions (purple arrows) contacting DFCs from neighbouring clusters. After the initial contact, DFCs from the lateral small cluster approach and establish adhesive contacts with the main cluster (red lines). Scale bar, 20 µm. (F) Schematic diagram showing the different types of protrusions formed by DFCs when two clusters approach and coalesce into a single cluster: long inter-cluster protrusions involved in cluster coalescence (purple), other inter-cluster protrusions (grey), and protrusions formed at lateral sides of the contacting clusters (white). The double-sided red arrow indicates the axis of alignment between approaching clusters. (G–I) Quantification of the length (G), lifetime (H), and alignment (I) of the protrusions described in (F). Boxes depict the interquartile range from 25% to 75% of the data around the average (vertical line inside the box), whiskers depict s.d., and stars indicate maximum and minimum values (n = 8 long inter-cluster protrusions from three embryos, 15 other inter-cluster protrusions from three embryos, and 14 lateral protrusions from three embryos). *** p ≤ 0.001; * (p ≤ 0.05). (J) Temporal confocal series from a representative Tg(sox17::utrn-GFP) embryo showing a DFC from a small lateral cluster (cell 3) sending long protrusions and establishing adhesive contacts with the main cluster before other DFCs from the small cluster (1 and 2) lose apical attachments (AT, arrowheads) (extracted from Figure 8—video 2). Scale bar, 20 µm. Animal is to the top in all image panels. Source data for all plots are provided in Figure 8—source data 1.
|