
Figure 3
- ID
- ZDB-IMAGE-210927-29
- Publication
- Pulgar et al., 2021 - Apical contacts stemming from incomplete delamination guide progenitor cell allocation through a dragging mechanism
- All Figures
- Figures for Pulgar et al., 2021
|
Figure 3
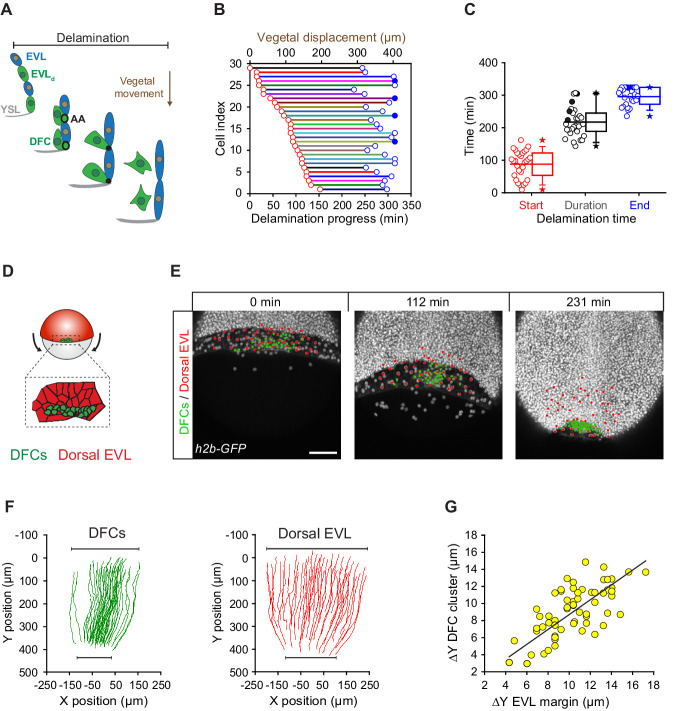
(A) Schematic diagram showing the origin of DFCs from the EVL through cell delamination. Apical attachments (AA) that result from apical constriction connect delaminating DFCs with the EVL and YSL during their vegetal movements. When DFCs complete delamination, they lose apical attachments and are released from the EVL and YSL. (B) Plot depicting the relationship between the time of the DFC delamination process and the vegetal movements of delaminating cells for all cells in a single representative Tg(actb1::lifeactin-RFP) embryo. The start (red circles) and end (blue circles) times of cell delamination, and the total duration of this process (horizontal lines) are shown for individual delaminating cells (bottom axis) and compared with their vegetal movements (top axis). Filled blue circles indicate a subset of delaminating cells that still retained their apical attachments by the end of the movies (n = 29 delaminating cells from one representative embryo). (C) Combined box and distribution plots of the start and end times, and of the total duration of cell delamination for the same representative embryo as in B. Circles correspond to individual values while the box depicts the interquartile range from 25% to 75% of the data around the average (vertical line inside the box), the whisker depicts s.d., and stars indicate maximum and minimum values. Filled blue and black circles indicate the subsets of delaminating cells that still retained apical attachments by the end of the movies (n = 29 delaminating cells from one representative embryo, same as in B). (D–G) Delaminating DFC mirrors the movement of dorsal EVL cells. Schematic diagram (D) and dorsal views of confocal z-stack maximum projections (E) of a representative wild-type embryo injected with h2b-GFP mRNA to label all nuclei (white dots) (extracted from Figure 3—video 1). (F) Tracks of delaminating cells (DFCs, green) and neighbouring non-delaminating dorsal EVL cells (red) between shield stage and 90% of epiboly, showing the paths of vegetal movement and convergence. (G) Correlation plot between the changes in position along the y-axis of the centre of mass of the DFC cluster and the EVL margin (Pearson’s r = 0.97552) (n = 62 tracked delta time points from three embryos). Scale bar, 100 µm. Animal is to the top in all image panels. Source data for all plots are provided Figure 3—source data 1.
Dorsal forerunner cell (DFC) delamination is asynchronous and coexists with the vegetal movement of DFCs and the enveloping layer (EVL).