
Figure 7
- ID
- ZDB-FIG-210927-35
- Publication
- Pulgar et al., 2021 - Apical contacts stemming from incomplete delamination guide progenitor cell allocation through a dragging mechanism
- Other Figures
- All Figure Page
- Back to All Figure Page
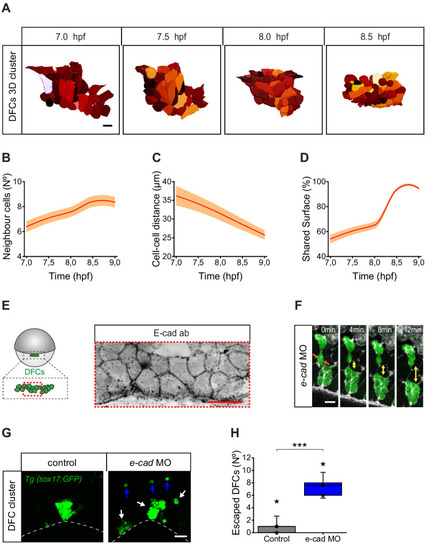
(A) Dorsal view of a 3D cell reconstruction of a single DFC cluster from a Tg(β-actin::HRAS-EGFP) embryo at different time points of collective movement. Individual cells are labelled in different colours according to their volume. Scale bar, 20 µm. (B–D) Quantification plots of the number of neighbour cells (B), and of the distance (C) and shared surface (D) between neighbouring DFCs (n = 44, 46, 47, 59 cells for 7, 7.5, 8, and 8.5 hpf, respectively, from a single embryo). (E) Dorsal view of confocal z-stack maximum projection of a DFC cluster immunostained for E-cadherin (E-cad) in a representative 60% epiboly embryo. Scale bar, 20 µm. (F) Time series of dorsal views of confocal z-stack maximum projections showing the evolution of a small raceme of DFCs in a representative 80% epiboly Tg(sox17::GFP) embryo injected with e-cad MO. The double-sided arrows indicate how the DFC raceme becomes apart as DFCs lose their initial adhesive contacts (arrows). Scale bar, 20 µm. (G) Dorsal views of confocal z-stack maximum projections showing DFCs from representative 80% epiboly Tg(sox17::GFP) control (left) and e-cad MO injected (right) embryos showing the defective collective organisation of DFCs into multiple racemes (white arrows) and the increase of escaped cells (blue arrows). Scale bar, 50 µm. (H) Quantification of the number of DFCs escaping from the central cluster towards the animal pole in control and e-cad MO injected embryos. The box depicts the interquartile range from 25% to 75% of the data around the average (vertical line inside the box), the whisker depicts s.d., and stars indicate maximum and minimum values (n = 5 embryos for e-cad MO and 9 embryos for control conditions). *** (p ≤ 0.001). Animal is to the top in all image panels. Source data for all plots are provided in Figure 7—source data 1.
|