
Figure 8
- ID
- ZDB-IMAGE-210927-40
- Publication
- Pulgar et al., 2021 - Apical contacts stemming from incomplete delamination guide progenitor cell allocation through a dragging mechanism
- All Figures
- Figures for Pulgar et al., 2021
|
Figure 8
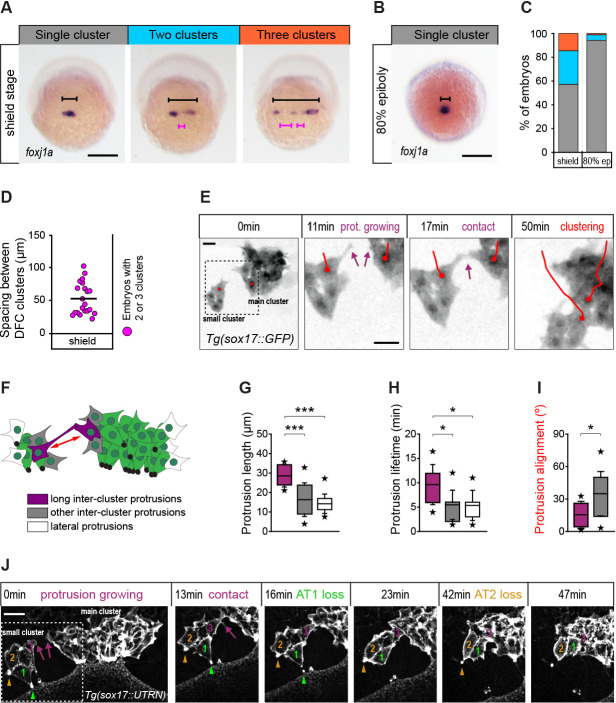
(A) Spatial distribution patterns of DFCs in dorsal views of wild-type embryos at shield stage revealed by foxj1a mRNA expression. During DFC formation, these cells are organised at the dorsal margin as single or multiple clusters spanning different widths (black bracket) along the medio-lateral axis, also showing variable spacing between clusters (purple bracket). (B) Same as in (A) showing an embryo with a single compact cluster (black bracket) at 80% epiboly. Scale bars of A and B, 250 µm. (C) Quantification of the percentage of embryos showing single (grey), two (light blue), or three (orange) DFC clusters at shield stage and at 80% of epiboly (n = 110 embryos at shield stage, and 88 embryos at 80% of epiboly). (D) Quantification of the spacing between DFC clusters at shield stage (n = 16 embryos with two or three clusters). (E) Temporal confocal series of DFCs from a Tg(sox17::GFP) embryo showing long protrusions (purple arrows) contacting DFCs from neighbouring clusters. After the initial contact, DFCs from the lateral small cluster approach and establish adhesive contacts with the main cluster (red lines). Scale bar, 20 µm. (F) Schematic diagram showing the different types of protrusions formed by DFCs when two clusters approach and coalesce into a single cluster: long inter-cluster protrusions involved in cluster coalescence (purple), other inter-cluster protrusions (grey), and protrusions formed at lateral sides of the contacting clusters (white). The double-sided red arrow indicates the axis of alignment between approaching clusters. (G–I) Quantification of the length (G), lifetime (H), and alignment (I) of the protrusions described in (F). Boxes depict the interquartile range from 25% to 75% of the data around the average (vertical line inside the box), whiskers depict s.d., and stars indicate maximum and minimum values (n = 8 long inter-cluster protrusions from three embryos, 15 other inter-cluster protrusions from three embryos, and 14 lateral protrusions from three embryos). *** p ≤ 0.001; * (p ≤ 0.05). (J) Temporal confocal series from a representative Tg(sox17::utrn-GFP) embryo showing a DFC from a small lateral cluster (cell 3) sending long protrusions and establishing adhesive contacts with the main cluster before other DFCs from the small cluster (1 and 2) lose apical attachments (AT, arrowheads) (extracted from Figure 8—video 2). Scale bar, 20 µm. Animal is to the top in all image panels. Source data for all plots are provided in Figure 8—source data 1.
Contact interactions between dorsal forerunner cells (DFCs) couple the motion of attached and detached cells promoting a clustered collective movement.