
Figure 1
- ID
- ZDB-IMAGE-210927-26
- Publication
- Pulgar et al., 2021 - Apical contacts stemming from incomplete delamination guide progenitor cell allocation through a dragging mechanism
- All Figures
- Figures for Pulgar et al., 2021
|
Figure 1
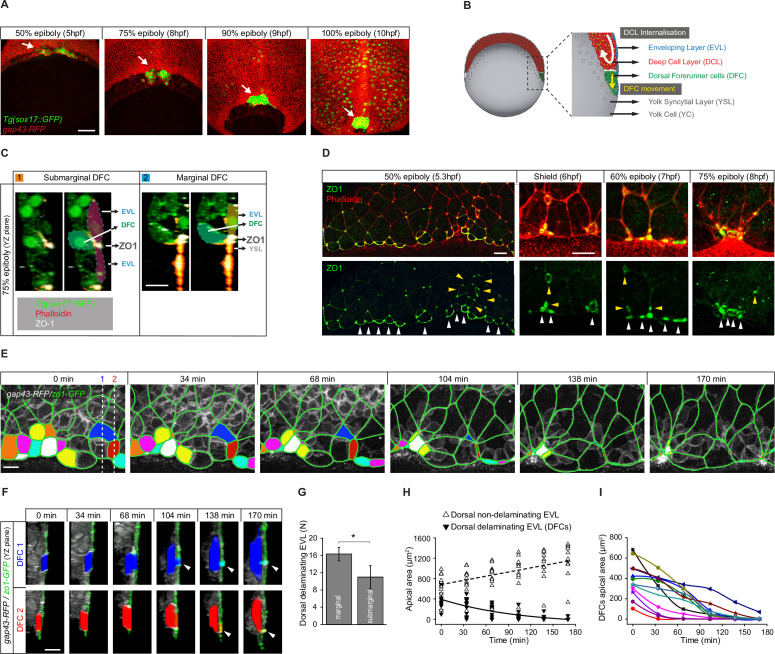
(A) Dorsal views of confocal z-stack maximum projections showing the collective vegetal movement of DFCs between shield stage and 100% epiboly in a representative Tg(sox17::GFP) embryo injected with gap43-RFP mRNA. DFCs are in green (arrows) while the plasma membrane of all cells is in red. Note that the sox17::GFP transgene also labels the scattered population of endodermal cells at advanced stages of epiboly (see criteria to discriminate DFCs from endodermal cells in Material and methods) (extracted from Figure 1—video 1). Scale bar, 100 µm. (B) Schematic diagram of a cross section along the sagittal plane of the zebrafish embryo at 60% of epiboly. DFCs move to the vegetal pole ahead of the deep cell layer (DCL) margin, where mesendodermal progenitors internalise. (C) Confocal microscopy zy-plane of a 75% epiboly Tg(sox17::GFP) embryo (green) stained with phalloidin (red) and zonula occludens one protein (ZO-1) (white), showing submarginal (left) and marginal (right) DFCs connected with the EVL and YSL by focal apical attachments enriched in ZO-1 and F-actin (extracted from Figure 1—figure supplement 1). Scale bar, 20 µm. (D) Phalloidin and ZO-1 immunostaining (merge on top and ZO-1 on bottom) of the dorsal margin of wild-type embryos between 50% and 75% epiboly. Images correspond to surface confocal sections showing the apical domains of marginal (white arrowheads) and submarginal (yellow arrowheads) delaminating DFCs in contact with the YSL and EVL. Scale bar, 20 µm. (E) Time series of dorsal views of confocal z-stack maximum projections of a representative embryo injected with zo1-GFP and gap43-RFP between 50% and 80% epiboly, showing EVL cell junctions (green outlines) and the apical domains of EVL cells as they delaminate to become DFCs (coloured areas) (extracted from Figure 1—video 2). Scale bar, 20 µm. (F) Time series of confocal z-sections showing two delaminating EVL cells (DFCs) taken from panel E in lateral views (blue and red cells) as they move below the plane of the EVL epithelium during the process of delamination. Note that delaminating cells retain a focal apical attachment with the EVL (arrowhead, top) and YSL (arrowhead, bottom). Scale bar, 20 µm. (G) Quantification of the number of dorsal EVL cells undergoing delamination to become DFCs at both marginal and submarginal positions, expressed as means ± s.d. *p ≤ 0.05 (n = 49 marginal DFCs and 33 submarginal DFCs from three embryos). (H) Temporal changes in apical area of delaminating dorsal EVL cells (DFCs) (black triangles) and neighbouring non-delaminating dorsal EVL cells (white triangles) in a representative embryo during the process of delamination (n = 12 DFCs and 11 dorsal EVL cells from the representative embryo shown in E). Continuous and dashed lines indicate the mean values of apical area of delaminating and non-delaminating dorsal EVL cells, respectively. (I) Temporal changes in apical area of individual delaminating DFCs in a representative embryo during the process of delamination (n = 12 delaminating DFCs from the representative embryo shown in E). Each curve corresponds to a single cell. Animal is to the top in all image panels. Source data for all plots are provided in Figure 1—source data 1.
Dorsal forerunner cells (DFCs) delaminate by apical constriction and retain apical attachments with the enveloping layer (EVL) and yolk syncytial layer (YSL).