
Figure 4
- ID
- ZDB-FIG-210927-28
- Publication
- Pulgar et al., 2021 - Apical contacts stemming from incomplete delamination guide progenitor cell allocation through a dragging mechanism
- Other Figures
- All Figure Page
- Back to All Figure Page
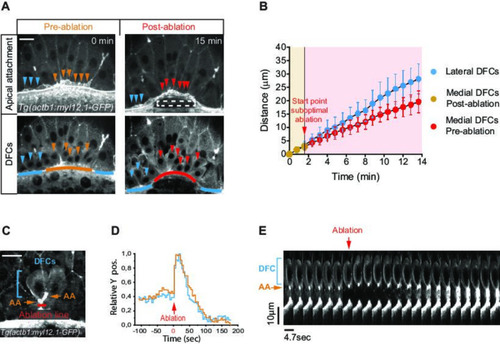
(A, B) Laser disruption of the yolk syncytial layer (YSL) actomyosin network impairs DFC vegetal movements. (A) Dorsal views of a Tg(actb1::myl12.1-GFP) embryo at early shield stage (5.8 hpf) before and after laser ablation of the cortical actomyosin ring of the YSL (extracted from Figure 4—video 1). Confocal optical planes are at the level of the enveloping layer (EVL) to reveal the apical attachments (top) and at a deeper z-position to show the body (bottom) of delaminating DFCs. The dashed rectangle depicts the zone of laser ablation. Arrowheads point to apical attachments (top) and the nuclei of individual DFCs (bottom), while lines depict the position of the EVL margin immediately above the ablation zone (orange and red) and lateral to this region (blue). Scale bar, 20 μm. (B) Plot showing the changes in position of delaminating DFCs along the y-axis before and after ablation, with the pulses of laser ablation starting just before minute 2 (red arrow). Medial and lateral DFCs correspond to the cells shown in panel A (coloured arrowheads), whose apical attachments associate with the EVL/YSL margin above or lateral to the ablated YSL zone, respectively. Values correspond to means ± s.d. (C–E) Laser line ablation of an EVL cortical junction below the apical attachments of two submarginal delaminating DFCs in a Tg(actb1::myl12.1-GFP) embryo at 70% of epiboly. (C) Dorsal view of a pre-ablation stage showing delaminating DFCs (blue bracket), their apical attachments (AA, orange arrows), and the ablation line (red). Scale bar, 20 µm. (D) Plot showing the changes in relative position of delaminating DFCs (blue) and apical attachments (orange) along the y-axis before and after ablation, with zero corresponding to the time of the laser pulse (red arrow). (E) Kymograph showing the movement of a DFC and its apical attachment during the laser ablation plotted in D (extracted from Figure 4—video 2). Scale bar, 10 µm. Animal is to the top in all image panels. Source data for all plots are provided in Figure 4—source data 1.
|