
Figure 6
- ID
- ZDB-IMAGE-210927-36
- Publication
- Pulgar et al., 2021 - Apical contacts stemming from incomplete delamination guide progenitor cell allocation through a dragging mechanism
- All Figures
- Figures for Pulgar et al., 2021
|
Figure 6
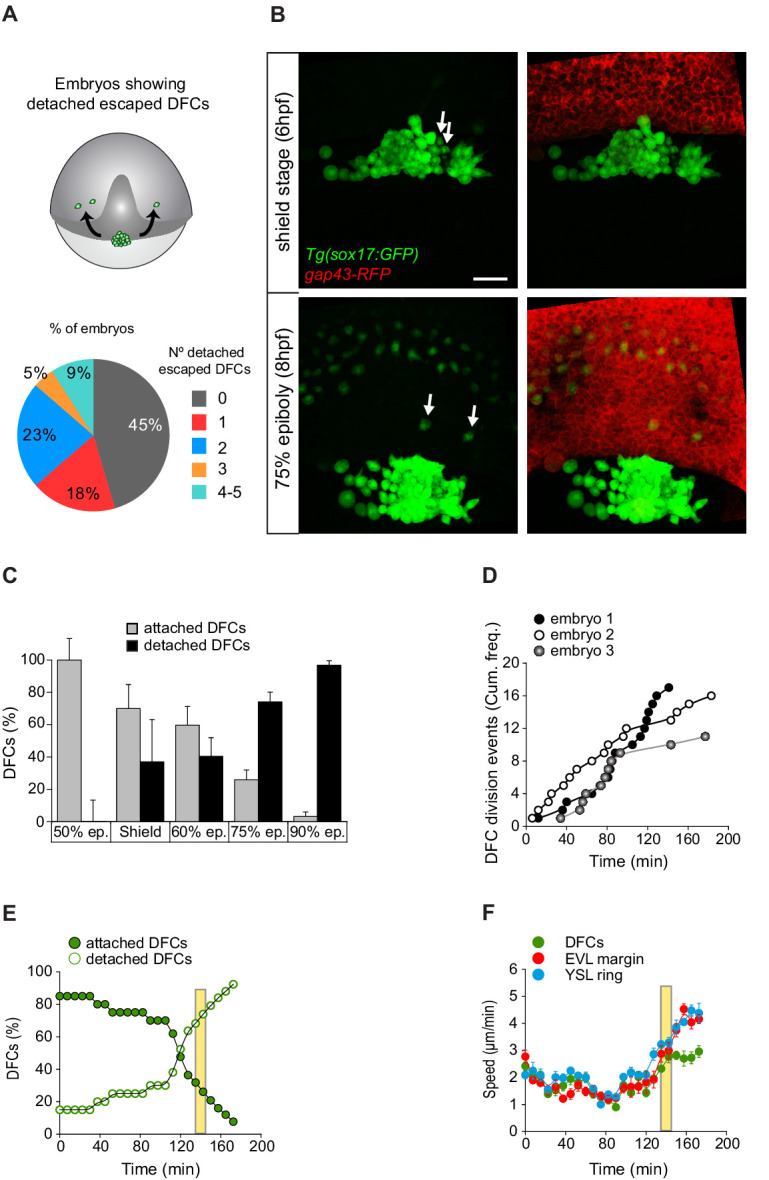
(A, B) Individual detached DFCs can leave the main cluster towards the deep cell layer (DCL) during normal development. (A) Schematic diagram showing events of escape (top) and quantification of the percentage of embryos showing escape events of defined numbers of detached DFCs after in vivo imaging of Tg(sox17::GFP) embryos (bottom, n = 22 embryos). (B) Dorsal views of confocal z-stack maximum projections at shield stage (top) and 75% epiboly (bottom) of a representative Tg(sox17::GFP) embryo injected with gap43-RFP mRNA, labelling DFCs in green and the plasma membrane of all cells in red (extracted from Figure 6—video 1). Arrows indicate two detached DFCs leaving the main cluster towards the DCL. These cells then mimic the behaviour of endodermal cells and differentiate into endodermal tissue derivatives (Figure 6—figure supplement 1). Scale bar, 50 µm. (C–E) Origin and progressive increase of detached DFCs during development. (C) Quantification of attached and detached DFCs between 50% and 90% epiboly (5.3–9 hpf), as determined from fixed embryos stained with phalloidin and zonula occludens one protein (ZO-1) (see Figure 1C and D). Values correspond to means ± s.d. (n = 5–11 embryos per stage). (D) Kinetic of cumulative frequency of DFC division events (n = 3 individual representative embryos). (E) In vivo kinetics of attached and detached DFCs in a single representative living Tg(sox17::GFP) embryo injected with lifeactin-mcherry mRNA to label F-actin. Plot shows the percentage of attached (filled green circles) and detached (empty green circles) DFCs over time. (F) In vivo progression in the movement speed of the centre of mass of the DFC cluster (green), the enveloping layer (EVL) margin (red), and the actomyosin ring of the yolk syncytial layer (YSL) (blue) (n = 10 DFCs, 5 EVL cell margins, and 4 actomyosin ring points from the same representative embryo as in E). Values correspond to means ± s.d. In E and F, movies started at shield stage and extended until 90% epiboly. The vertical yellow bar indicates the stage when the movement of DFCs uncouples from the vegetal movement of the EVL and YSL (around 80% epiboly, when detached DFCs reach ∼80%). Animal is to the top in all image panels. Source data for all plots are provided in Figure 6—source data 1.
Dorsal forerunner cells (DFCs) move to the vegetal pole as a collective despite the increase of detached cells.