Figure 2
- ID
- ZDB-FIG-210927-25
- Publication
- Pulgar et al., 2021 - Apical contacts stemming from incomplete delamination guide progenitor cell allocation through a dragging mechanism
- Other Figures
- All Figure Page
- Back to All Figure Page
|
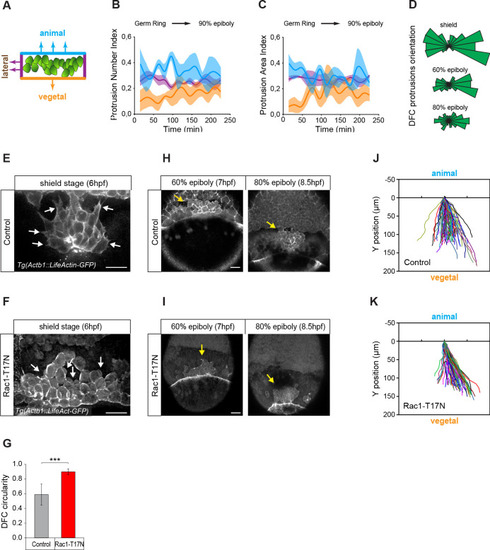
(A) Schematic representation of the DFC cluster showing how cell protrusions extending from the vegetal (orange), lateral (purple), and animal (light blue) edges of the cluster were quantified in Tg(actb1::lifeactin-RFP) embryos to build the plots of (B) and (C). (B) Kinetic of normalised DFC protrusion number in living embryos (n = 3 embryos). (C) Kinetic of normalised DFC protrusion area in living embryos (n = 3 embryos). (D) Circular distribution plots of DFC protrusion orientation at different developmental stages obtained from fixed Tg(sox17::utrn-GFP) embryos (n = 11, 10, and 9 embryos for shield, 60% epiboly and 80% epiboly, respectively). (E, F) Dorsal views of confocal z-stack maximum projections showing the protrusions formed in DFCs (white arrows) from representative living Tg(actb1::lifeactin-RFP) embryos at shield stage in control (E) and Rac1-T17N injected (F) conditions. Scale bar, 20 µm. (G) Plot of circularity index of DFC protrusions in control and Rac1-T17N injected embryos, expressed as means ± s.d. ***p ≤ 0.001 (n = 42 cells from two control embryos and 62 cells from 3 Rac1-T17N embryos). (H, I) Dorsal views of confocal z-stack maximum projections showing the vegetal movement of the DFC cluster (yellow arrows) from representative living Tg(actb1:lifeactin-RFP) embryos from 60% to 80% epiboly stages in control (H) and Rac1-T17N injected (I) conditions. Scale bar, 20 µm. (J, K) Tracking plots of DFC movement in control (J) and Rac1-T17N injected (K) conditions, showing the directional movement of DFCs (n = 2 embryos for control and 3 embryos for Rac1-T17N injected conditions). Animal is to the top in all image panels. Source data for all plots are provided in Figure 2—source data 1.
|

